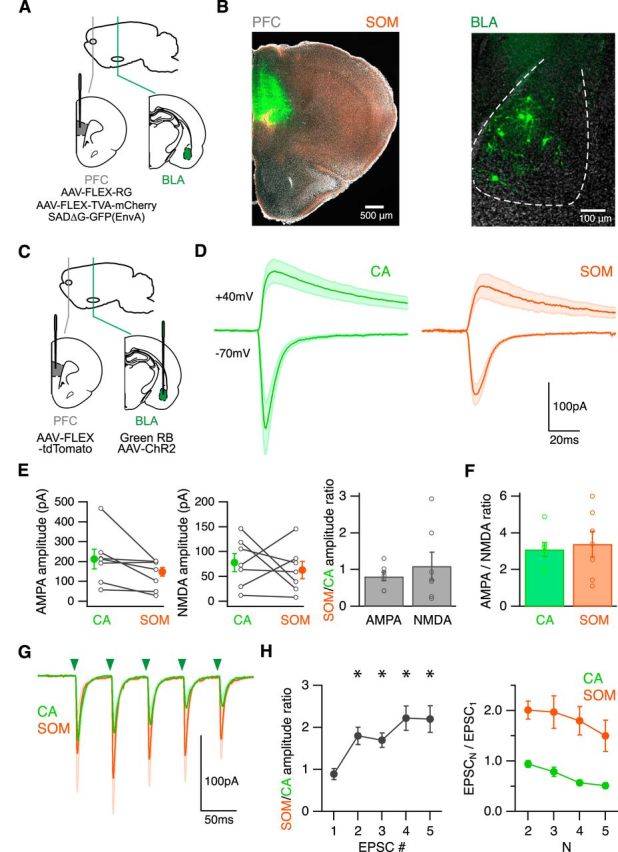
Figure 7.

Facilitating BLA inputs onto SOM interneurons. A, Schematic of injecting AAV-FLEX-RG, AAV-FLEX-TVA-mCherry, and SADΔG-GFP(EnvA) into the PFC of SOM-Cre mice, to retrogradely label monosynaptically connected cells in the BLA. B, Left, Coronal image showing the injection site in the PFC. Right, GFP-expressing neurons in the BLA that project to SOM interneurons. C, Schematic of injecting AAV-FLEX-tdTomato into the PFC and green beads and AAV-ChR2-eYFP into the BLA of SOM-Cre mice, to label SOM interneurons and CA neurons and express ChR2 in BLA axons in the infralimbic PFC. D, Average BLA-evoked AMPA-R and NMDA-R EPSCs in the presence of TTX, 4-AP, high Ca2+, and gabazine. Green arrowhead indicates time of LED pulse. E, Summary of amplitudes of BLA-evoked AMPA (left) and NMDA (middle) EPSCs at CA and SOM neurons. Lines connect pairs of recorded neurons. Right, Summary of SOM/CA amplitude ratio. F, Summary of AMPA/NMDA ratio at CA and SOM neurons. G, Average AMPA-R EPSCs evoked by trains of BLA inputs (5 pulses at 20 Hz) in the presence of CPP and gabazine. Green arrowheads indicate timing of LED pulses. H, Summary of SOM/CA amplitude ratio (left) and PPR (right) during trains. *p < 0.05.
