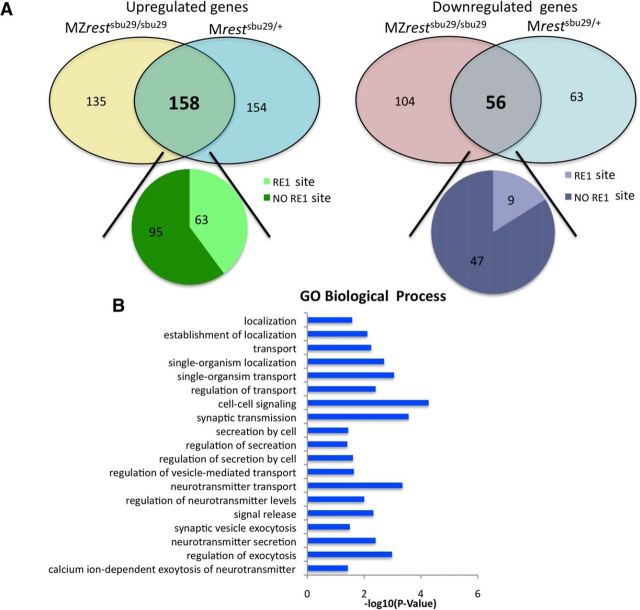
Figure 1.
Transcriptome comparison of Mrestsbu29/+ and MZrestsbu29/sbu29. A, Venn diagram showing the overlap of upregulated and downregulated genes in Mrestsbu29/+ and MZrestsbu29/sbu29 blastula. The number of genes with a predicted RE1 site near them is indicated. B, GO analysis showing the significant biological processes that are enriched in the upregulated genes.

