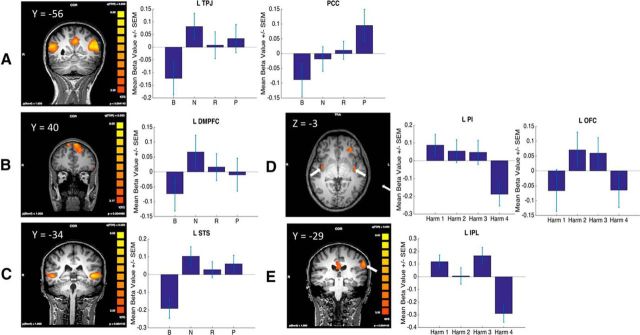
Figure 3.
A–C, Left, SPM results of the contrast mental state − harm, highlighting. TPJ and PCC (A), DMPFC (B), and STS (C). Right, Activity in the respective ROIs (when the ROI is bilateral, we only show the left) as a function of mental state level. D, E, Left, SPM results of the contrast harm − mental state illustrating PI and left OFC (D) and left IPL (E). Right, Activity in the respective ROIs as a function of harm level.

