
Figure 3.
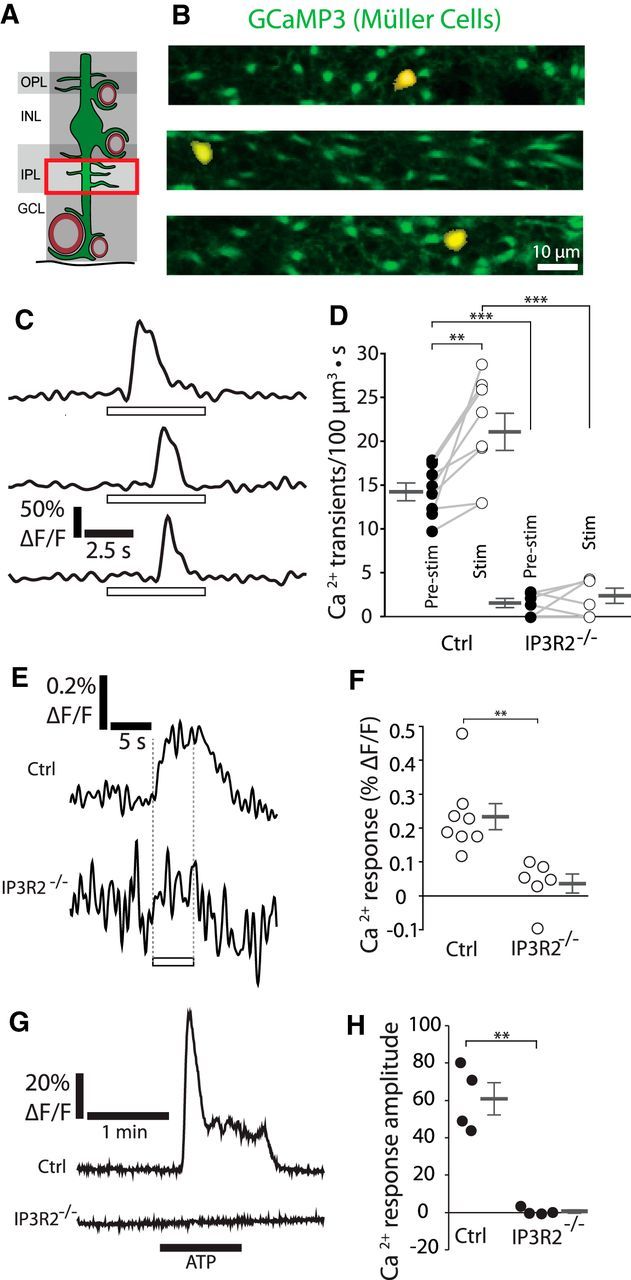
Calcium signaling in the fine processes of Müller cells. A, Calcium signaling was monitored in the fine processes of Müller cells in the inner plexiform layer (IPL). GCL, Ganglion cell layer; INL, inner nuclear layer; OPL, outer plexiform layer. B, Examples of Ca2+ transients in the fine processes of Müller cells. The Ca2+ transients (yellow; where GCaMP3 fluorescence exceeded a threshold) are overlaid on images of GCaMP3-labeled Müller cells (green). Similar images were obtained for 85 Ca2+ transients from eight eyecups. C, Traces of the Ca2+ transients in B. Open rectangles in this and other figures show the time course of the stimulus. D, The frequency of Ca2+ transients increased during stimulation (Stim) in control mice (Ctrl, p = 0.0065). Both spontaneous (Pre-stim, p = 3.6 × 10⁻⁷) and stimulus-evoked transient frequencies (p = 1.0 × 10⁻⁵) were reduced in IP3R2−/− mice (n = 8 control eyecups, 6 IP3R2−/− eyecups; two-way ANOVA with Bonferroni posttest; control pre-stim, 14.2 ± 1.0 Ca2+ transients/100 μm3 · s; control stim, 21.1 ± 2.1 Ca2+ transients/100 μm3 · s; IP3R2−/− pre-stim, 1.5 ± 0.48 Ca2+ transients/100 μm3 · s; stim, IP3R2−/−, 2.4 ± 0.79 Ca2+ transients/100 μm3 · s). E, Mean stimulus-evoked Ca2+ activity across all fine processes in control and IP3R2−/− mice. F, Amplitude of stimulus-evoked Ca2+ responses in E (n = 8 control eyecups, 6 IP3R2−/− eyecups; Mann–Whitney U test, p = 0.0024; control, 0.23 ± 0.036% ΔF/F; IP3R2−/−, 0.036 ± 0.026% ΔF/F). G, Representative Ca2+ responses to bath application of 10 μm ATP onto eyecups from control and IP3R2−/− littermate mice. H, Mean Ca2+ response amplitude to 10 μm ATP, measured in the IPL (n = 4 eyecups per group; unpaired t test, p = 0.0058; Ca2+ response amplitude, control, 60.9 ± 8.7% ΔF/F; IP3R2−/−, 0.5 ± 0.9% ΔF/F). **p < 0.01; ***p < 0.001.