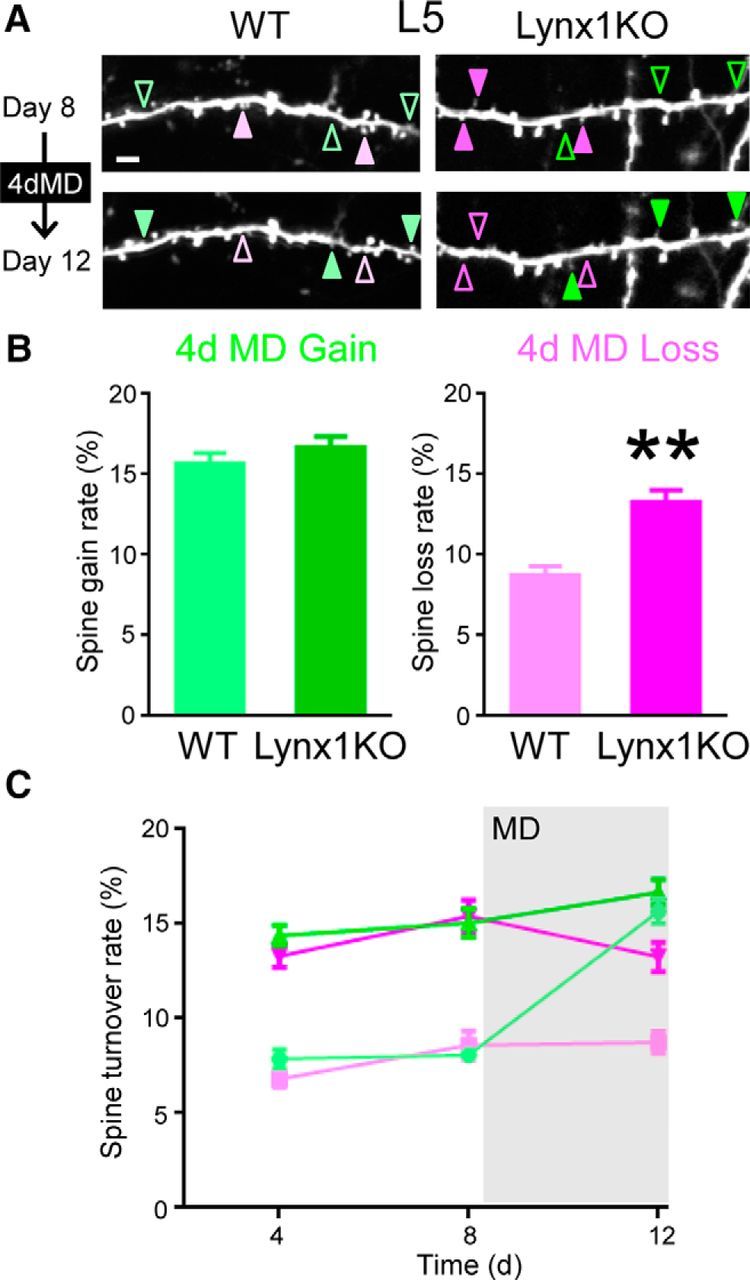
Figure 3.

Spine loss rate of adult L5 V1 neurons is higher in Lynx1-KO mice than in WT mice during MD. A, Repeated imaging of dendritic segment of adult L5 neurons before (day 8) and after (day 12) MD (4dMD). Light green (WT) and green (KO) arrowheads indicate spine gain. Light magenta (WT) and magenta (KO) arrowheads indicate spine loss. One to three dendrites were imaged from each cell to count total, gained, and lost spines in each cell. Scale bar, 5 μm. B, Spine gain and loss rate after 4 d of MD. Spine loss rate was significantly higher in adult Lynx1-KO mice than in WT mice (WT: n = 11 cells from 5 mice, KO: n = 12 cells from 7 mice). **p < 0.01, Student's t test. C, Spine turnover rates over 4 d were plotted as a function of time. Light green, light magenta, green, and magenta indicate WT gain, WT loss, Lynx1-KO gain, and Lynx1-KO loss, respectively. MD occurred right after day 8 imaging. Initial statistical analysis was done using MANOVA, in which interactions among three factors: genotype (knock out/wild type), type (gain/loss), and time (day 4/day 8/day 12) were assessed. Turnover rates significantly differed between genotypes (KO vs WT, df = 42, exact F value = 113.18, p < 0.0001). Interaction between genotype and type was not statistically significant (df = 42, exact F value = 1.216, p = 0.277). Therefore, effects for “loss” or “gain” value were independently assessed with the generalized linear model, in which “genotype” and “time” were adopted as fixed-effects variables and “cell” was adopted as a random-effect variable. For loss rate, both “time” and “genotype” were statistically significant. (df = 52, F = 4.901 and p = 0.011 for time and F = 125.843 and p < 0.001 for genotype, respectively). As the result of post hoc pairwise comparisons using Bonferroni modification, loss values for KO were significantly different between day 12 and day 8 (p = 0.047. 95%CI: 0.019–4.262), whereas no other comparisons were statistically significant (KO: days 4–8, days 4–12 and WT: days 4–8, days 4–12, days 8–12). For gain rate, both “time” and “genotype” were statistically significant (df = 52, F = 43.439 and p < 0.001 for time and F = 92.171 and p < 0.001 for genotype, respectively). As the result of post hoc pairwise comparisons using Bonferroni modification, gain values for WT significantly differed in between day 8 and day 12 (p < 0.001. 95%CI: −9.754 to −5.463), whereas there was no significant difference for KO (days 8–12). Data are presented as mean ± SEM.
