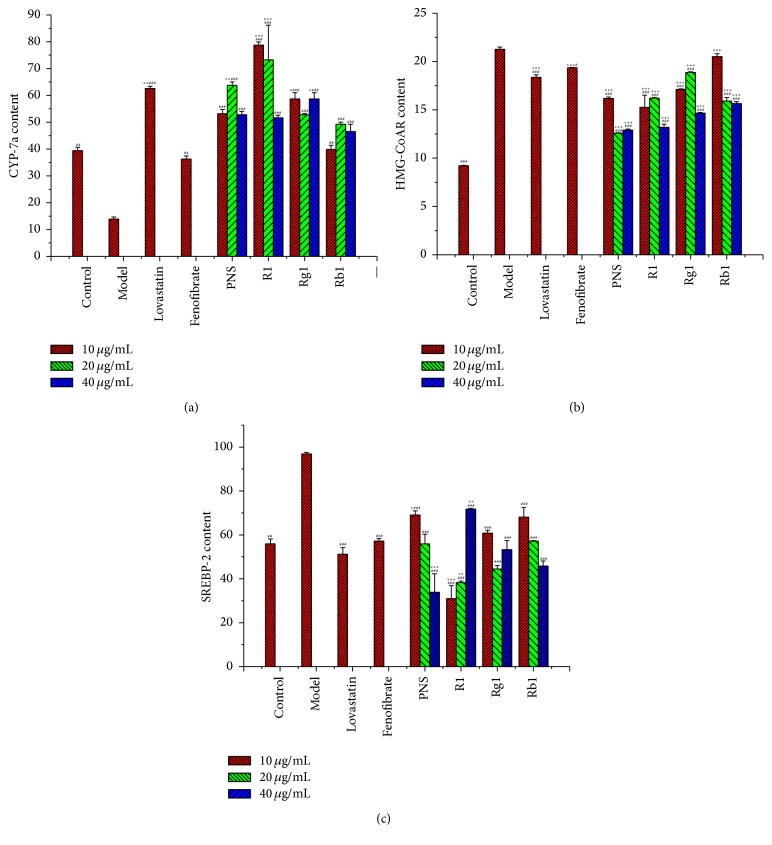
Figure 3.
CYP7α, HMG-CoAR, and SREBP-2 contents in the steatotic L02 cells after treatment of triterpenoid saponins. CYP7α (a), HMG-CoAR (b), and SREBP-2 (c) contents were assayed by assay kits as described in the text. Values were mean ± SD (n = 3) and expressed in mmol/L. PNS, Panax notoginsenosides. ∗ indicates a significant difference compared with control group cells, and # indicates a significant difference compared with model group cells. ∗ p < 0.05. ∗∗ p < 0.01. ∗∗∗ p < 0.001. ## p < 0.01. ### p < 0.001.

