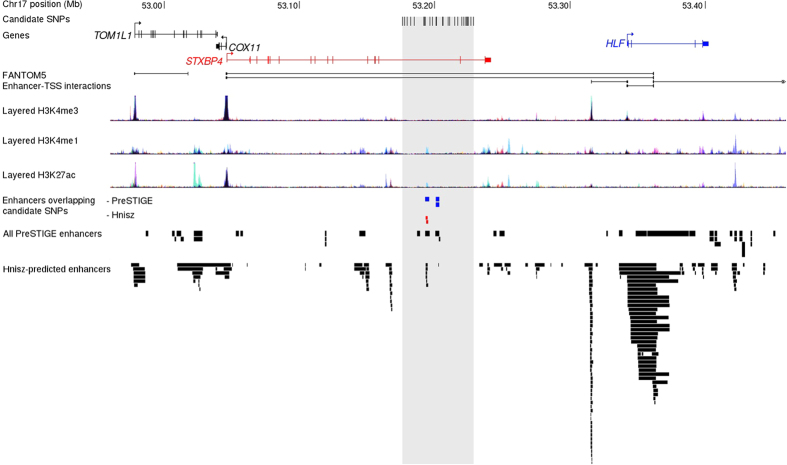
Figure 3. Functional annotation of the 17q22 locus.
Positions of candidate causal variants are shown as black tick marks in relation to local genes. Epigenomic marks associated with enhancers are shown as described by FANTOM, ENCODE, PreSTIGE and Hnisz et al.18. Enhancers which overlap candidate SNPs are coded in color to match their predicted target gene. The grey shaded region area depicts the region bound by un-excluded variants.

