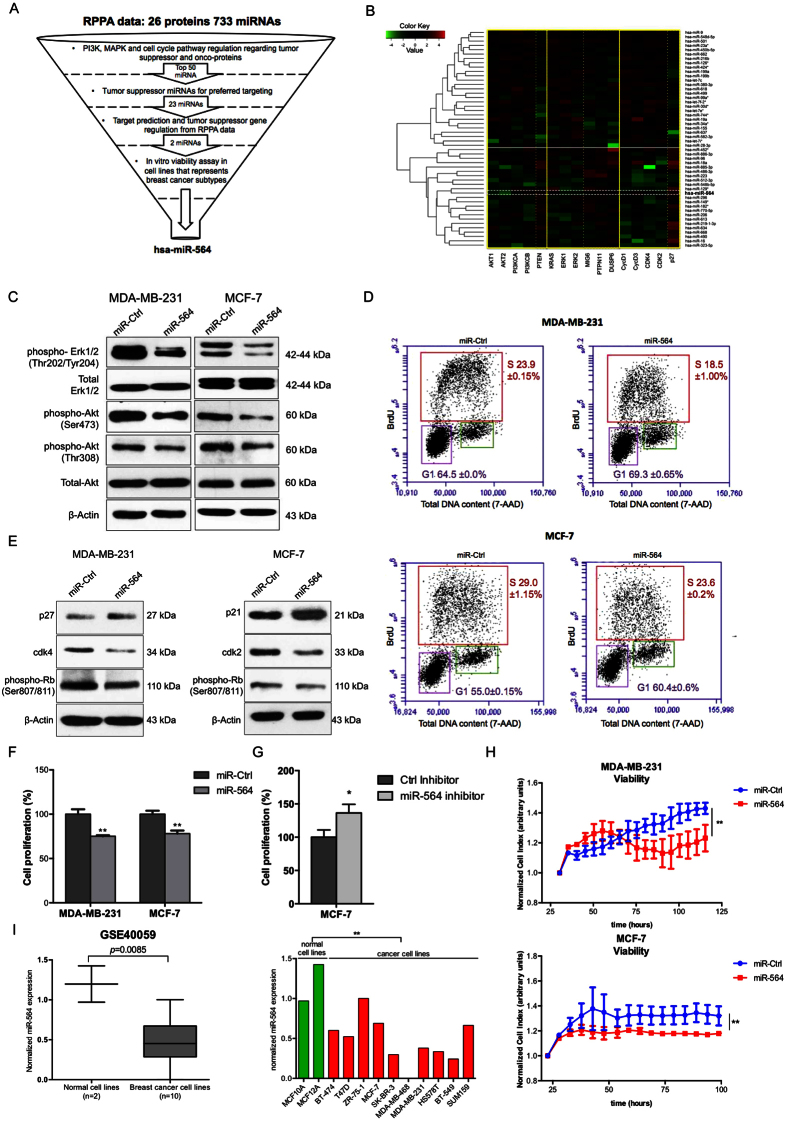
Figure 1. miR-564 suppresses both PI3K and MAPK pathways and reduces the viability of breast cancer cells via inducing a G1 cell cycle arrest.
(A) Flowchart showing selection process for candidate miRNA using the data from miRNA mimic screen with RPPA output in MDA-MB-231 breast cancer cell line. (B) Heatmap depicting correlations of top 50 miRNAs with tumor suppressor or oncogenes from PI3K and MAPK pathways as well as cell cycle pathway from RPPA data. X-axis is classified into groups according to components involved in different pathways. Y-axis is clustered using hcluster from R conductor. The miRNAs above white line are potential oncogenes while those below are potential tumor suppressors. (C) Western blots showing decreased expression and phosphorylation of proteins linked with PI3K and MAPK pathways. Full length western blot images for phospho-Akt (T308) and phospho-ERK1/2 are shown in Supplementary Fig. 6. (D) BrdU/7-AAD staining of MDA-MB-231 and MCF-7 cell lines transiently transfected with miR-564 or scramble control. (E) Western blot analyses of G1/S transition proteins in miR-564 mimic transfected MDA-MB-231 and MCF-7 cells. (F) End-point cell viability assay performed upon miR-564 mimic transfection in MDA-MB-231 and MCF-7 cells. (G) End-point cell viability assay performed upon miR-564 hairpin inhibitor transfection in MCF-7 cells. (H) Real-time cell proliferation analysis in the presence of miR-564 transfection or control miRNA. Statistical significance of results was tested using paired two-tailed student t-test. (I) Expression of miR-564 in GSE40059 dataset with 12 different breast cell lines classified as cancerous versus normal (left panel). Expression in each cell line is depicted as relative expression with respect to MDA-MB-468 (right panel).

