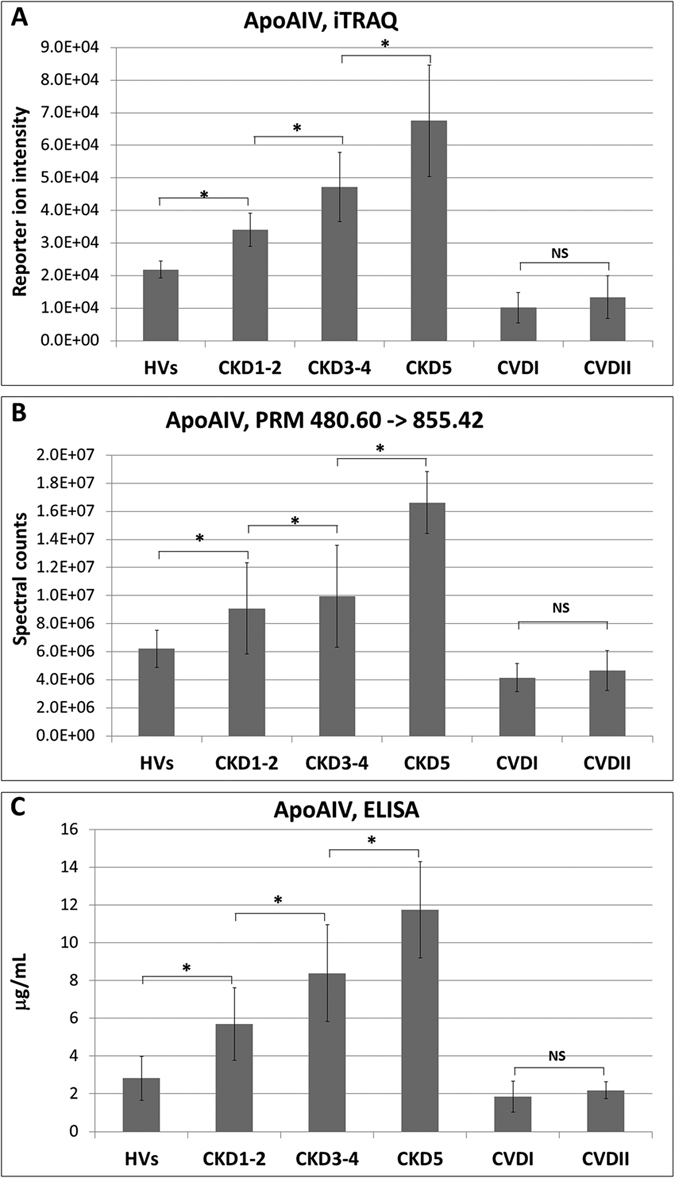
Figure 5.

(A) Relative abundance of apoAIV in HVs, CKD1-2, CKD3-4, CKD5, CVDI and CVDII groups based on reporter ion intensities. (B) Relative abundance of apoAIV in experimental groups based on PRM analysis showing transition 480.60 m/z to 855.42 m/z. (C) ELISA measurements of apoAIV. Charts show mean and SD for all analyzed plasma samples. Anova and Student’s t-tests were completed and statistical significance is indicated (*P < 0.05, NS-non-significant).
