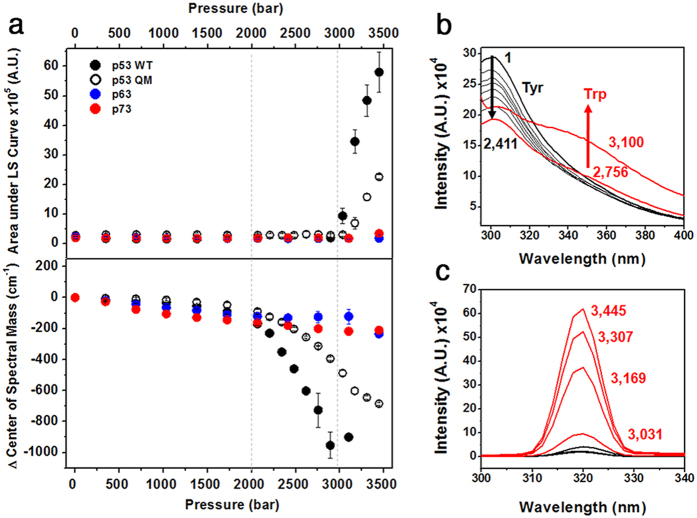
Figure 2. Stability of p53 family members against pressure.
(a) Light scattering (top) and changes in the center of spectral mass from Tyr/Trp emission spectra (bottom) were recorded as a function of increasing pressures for p53 family members, and p53 QM. Vertical dashed lines show the pressure range in which initial unfolding but not aggregation takes place. (b) Tyr/Trp emission spectra and (c) light scattering dependence upon pressure increments for p53 wt. Inset values represent pressure in bar units.

