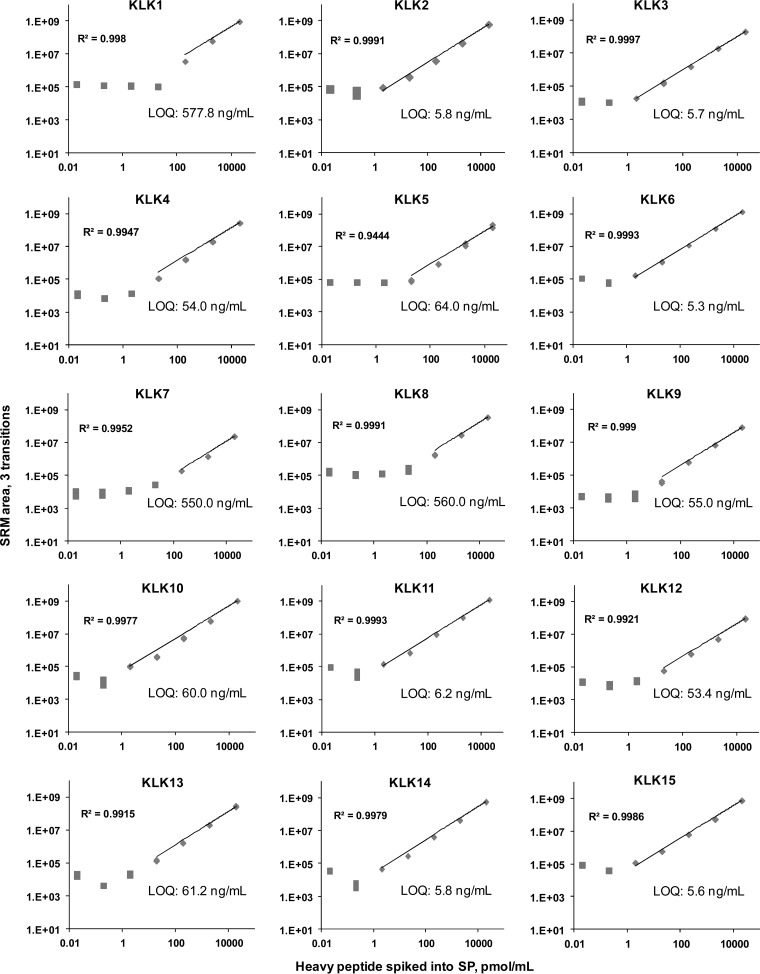
Fig. 2.
SRM method validation in SP using the triple quadrupole mass spectrometer. Each sample was analyzed in triplicates, and LOQs were defined as the lowest concentration measured with CV ≤ 20% within the linear range of the calibration curve. Because of different performances of proteotypic peptides, LOQs ranged from 5.3 to 578 ng/ml. CVs at the LOQ level were between 0.4% and 18.3%. Square and diamond shapes denote concentrations below and above LODs, respectively.

