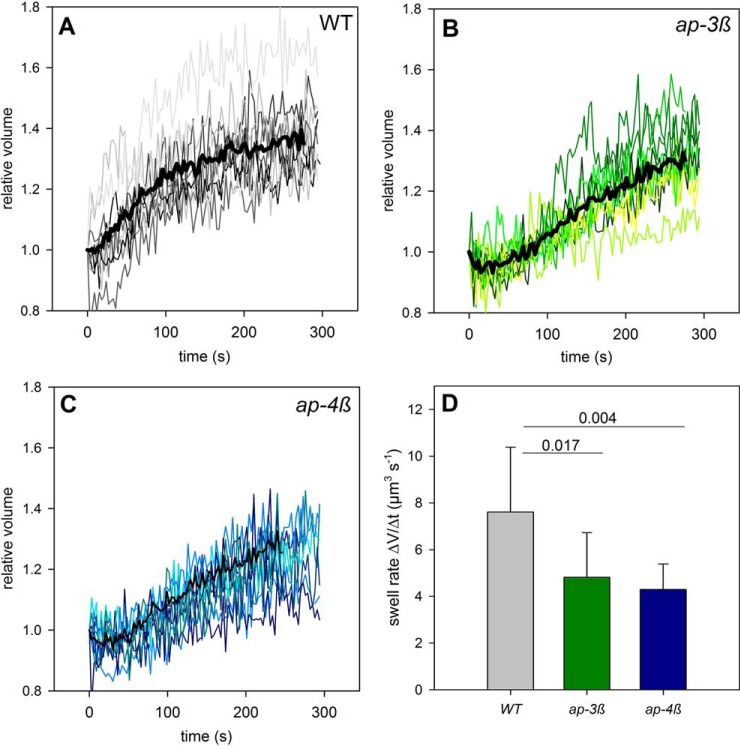
Fig. 5.
Water transport measured by swelling rates of mesophyll cell protoplasts. Relative volumes of individual protoplasts (gray) and the resulting average swell rate of (A) wild type col-0, (B) ap-3β mutant, and (C) ap-4β mutant. D, Averaged volume increase rates with standard deviations of 10 protoplasts each.

