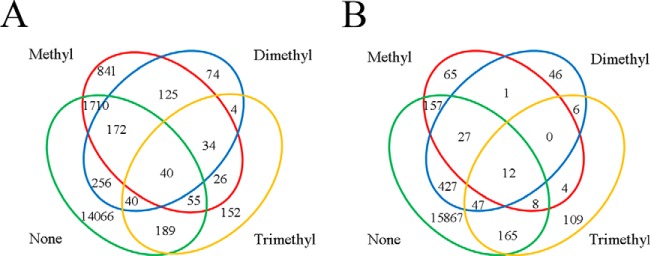
Fig. 4.
Schematic representation of lysine residues that were methylated to various extents. The extents of methylation on lysine residues, as identified by mass spectrometry in parent (A) or ΔaKMT (B), are depicted in a Venn diagram. Unmethylated, monomethylated, dimethylated or trimethylated lysine residues are indicated by none, methyl, dimethyl, or trimethyl, respectively.

