Fig. 6.

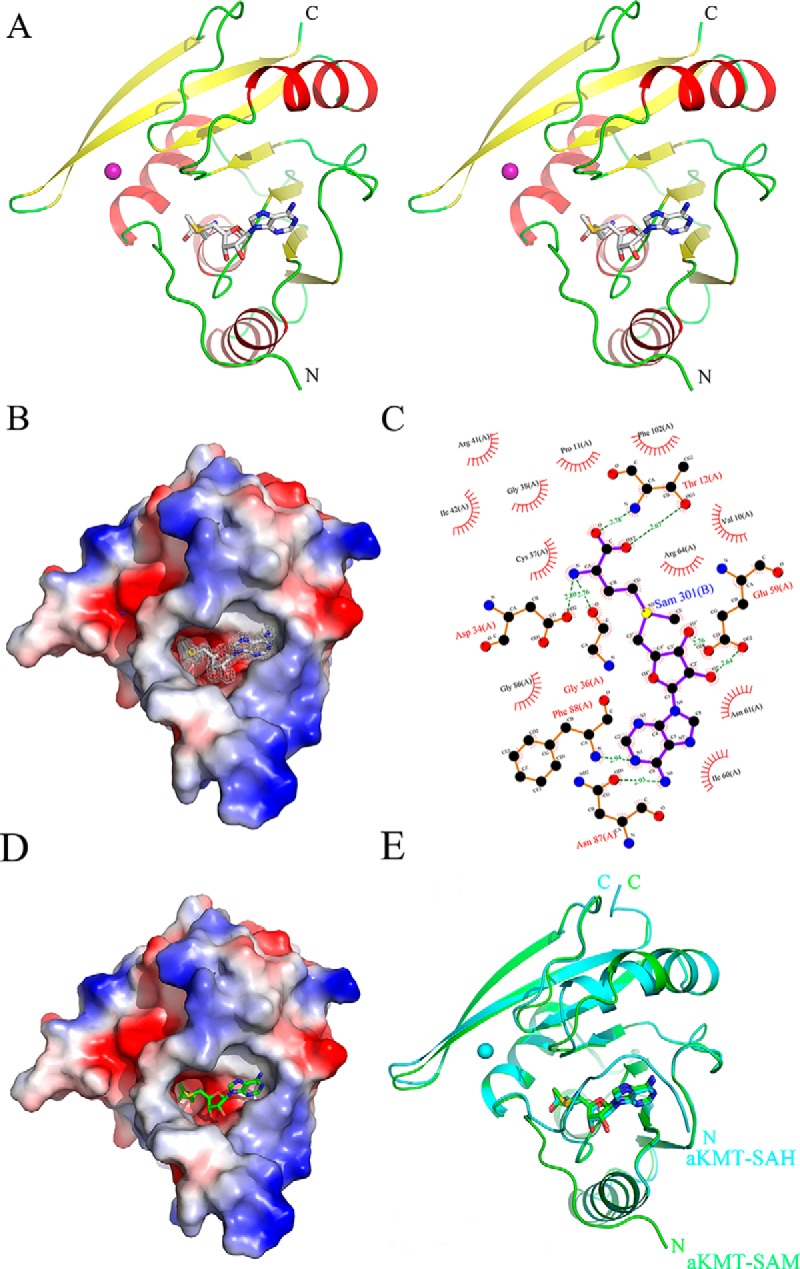
The crystal structures of aKMT-SAM and aKMT-SAH. A, Stereo view of the the aKMT-SAM structure. The structure is shown as a ribbon diagram with the α helices and the β sheets colored in red and yellow, respectively. The SAM molecule is shown as gray sticks. The purple sphere represents a magnesium ion. The N- and C termini are labeled with the respective letters. B, The solvent-accessible surface of aKMT in complex with SAM, colored according to electrostatic potential. Blue, positively charged; red, negatively charged; white, neutral. Electron density of a 2Fo-Fc simulated annealing (SA) omit map for SAM bound in the catalytic pocket contoured at 1.0σ is shown. The SAM molecule is shown as gray sticks. C, Schematic diagram summarizing the interactions between aKMT and SAM in the aKMT-SAM structure generated by LIGPLOT (67). Interacting atoms are connected by green dashed lines with bonding lengths indicated (in Å). Nonligand residues involved in direct hydrophobic contacts with SAM are shown as red semicircles with radiating spokes. D, The solvent-accessible surface of aKMT in complex with SAH, colored according to electrostatic potential. Blue, positively charged; red, negatively charged; white, neutral. The SAH molecule is shown as green sticks. E, Comparison of the structures of aKMT-SAH (cylan) and aKMT-SAM (green).
