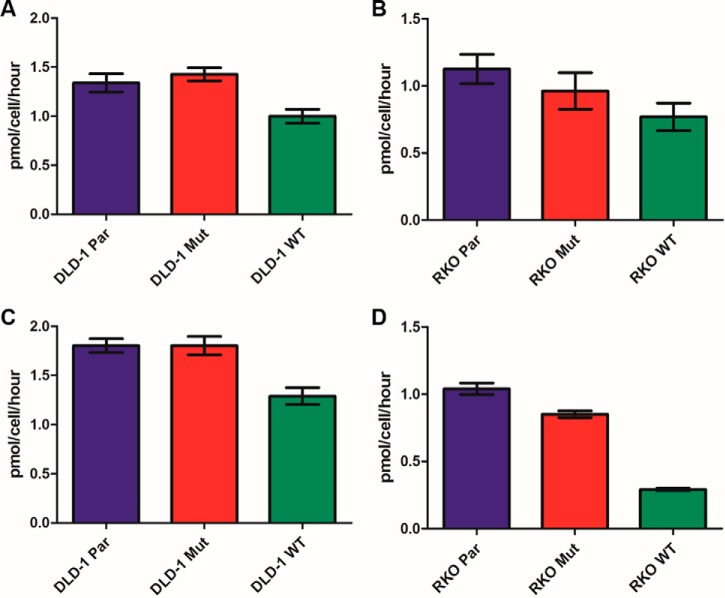
Fig. 2.
Glucose consumption and lactate production rates in isogenic cell lines. Glucose consumption and lactate production rates were determined from 3 biological replicates per cell line. Growth media collected from cultured cell lines every doubling and half-doubling time was analyzed in duplicate on a YSI 2300 STAT Plus Glucose and Lactate Analyzer. Error bars represent the standard error of the mean. A and B, show glucose consumption rates in DLD-1 and RKO cells, respectively. C and D, show lactate production rates in DLD-1 and RKO cells, respectively.

