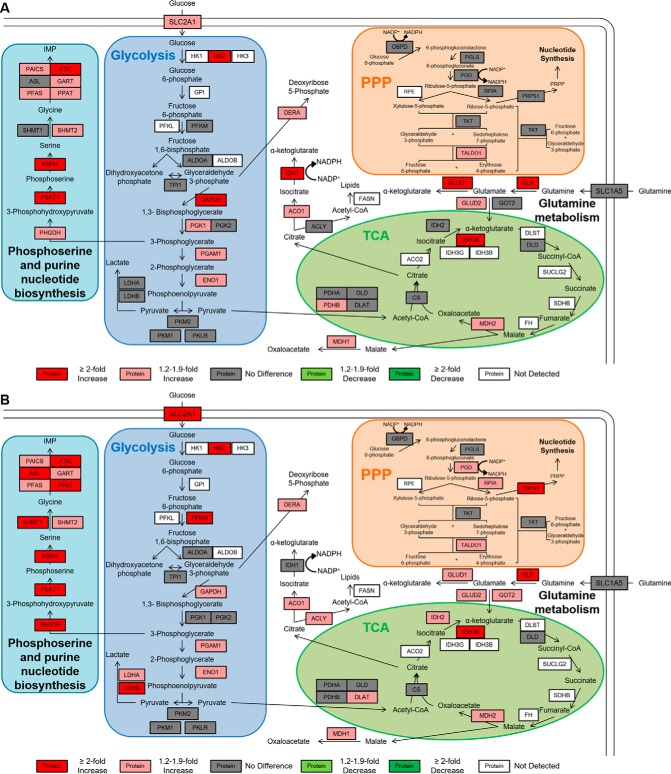
Fig. 5.
Pathway map of quantitative comparisons of metabolic proteins in RKO cell lines. Pairwise comparisons of metabolic PRM measurements of A, RKO Mut versus RKO WT and B, RKO Par versus RKO WT. Peptides with the lowest CV and largest normalized peak area were used for quantitative comparisons, and normalized peak area for all detected peptides are shown in supplemental Fig. S4. The legend for each pairwise comparison shows fold changes relative to the cell line listed first in each comparison. Proteins with a CV < 0.25, an ICC > 0.6, and a p < 0.05 and that are higher in the first cell line are shown in red (at least a twofold difference) or light red (between 1.2- and 1.9-fold difference). Proteins with a CV < 0.25, an ICC > 0.6, and a p < 0.05 and that are lower in the first cell line are shown in green (at least a 2-fold difference) or light green (between 1.2- and 1.9-fold difference). Proteins with a CV < 0.25, an ICC > 0.6, but a p > 0.05 or with a CV < 0.25 but an ICC < 0.6 are listed in gray (no difference). Proteins with a CV > 0.25 or with no detectable peak area are shown in white.

