
Fig. 8.
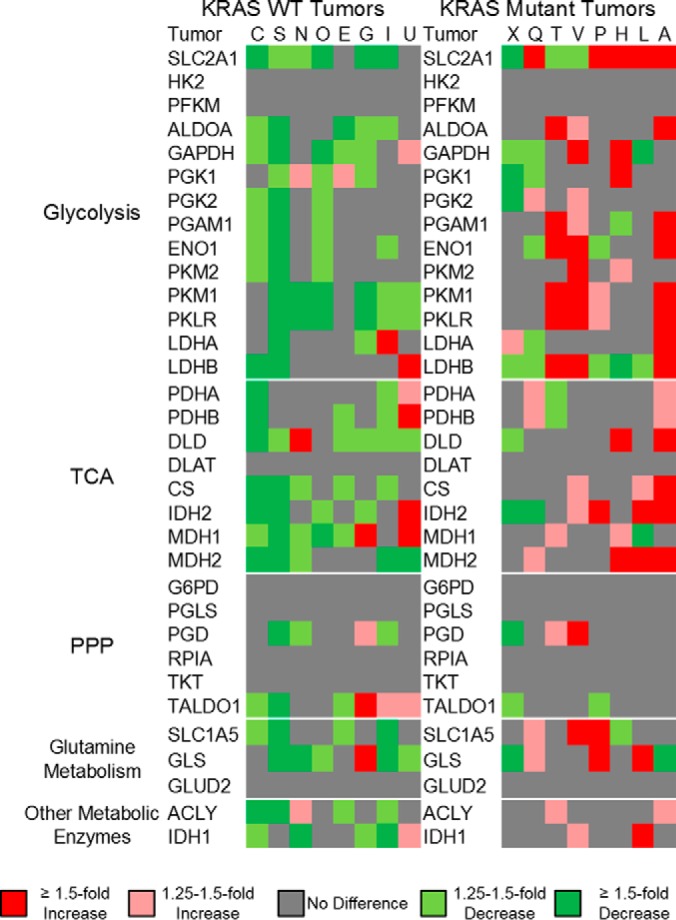
Summary of MRM measurements in human stage II colorectal cancers. Normalized peptide measurement from each sample was compared with the mean normalized peak area for each individual peptide from all tumor samples. These comparisons were then classified as either no difference from the mean (gray color), 1.25- to 1.5-fold above or below the mean (light red and light green, respectively), greater than 1.5-fold above or below the mean (dark red or dark green, respectively), or not detected (white). Proteins are organized into glycolysis, TCA, PPP, glutamine metabolism, and other metabolic enzymes.