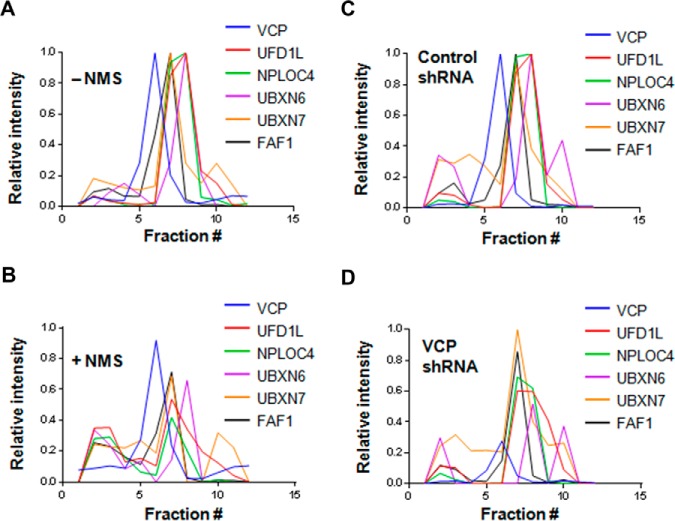
Fig. 2.
Analysis of the fractionation behavior of VCP and its adaptors by SEC-mass spectrometry in response to modulation of VCP activity. A, The relative LFQ intensity of peptides from VCP and Class IV adaptors in SEC fractions from untreated HEK293 cells were averaged to generate an estimate of the level of these proteins in each fraction. These levels were then plotted. Quantitative data on the behavior of triplicates for each protein are provided in supplemental Fig. S2D. B, same as panel A, except that cells were treated with 10 μm NMS873 for 6 h prior to lysis. C, Same as panel A, except that cells were transfected with control shRNA 96 h prior to lysis. D, Same as panel A, except that cells were transfected with shRNA against VCP sequences 96 h prior to lysis.

