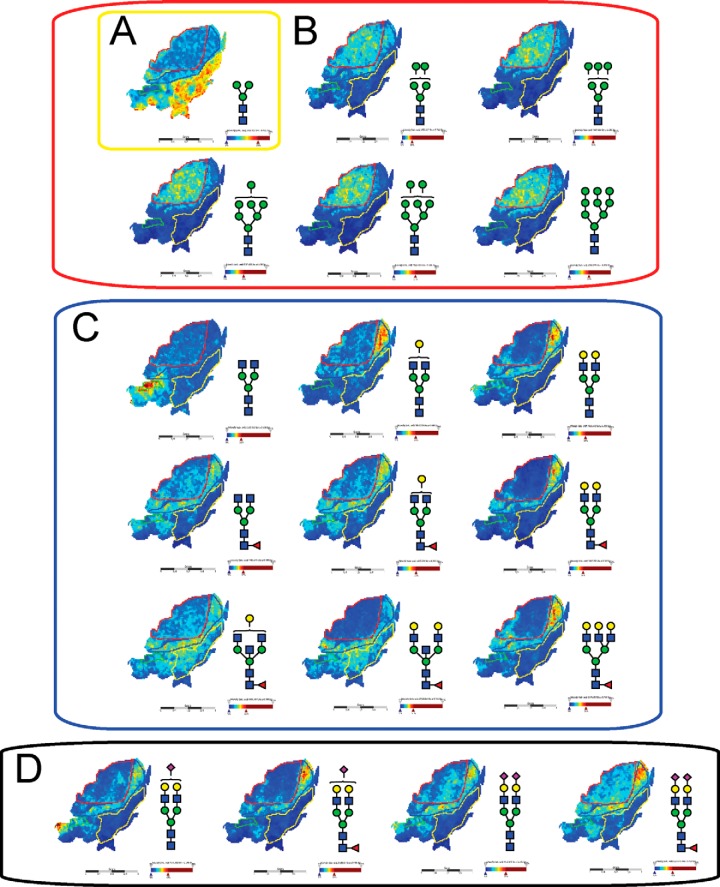
Fig. 3.
MALDI mass spectrometric imaging of N-linked glycans released from patient P1 ovarian cancer tissue sections. Formalin-fixed paraffin-embedded ovarian cancer tissue sections were treated with antigen retrieval prior to printing of 15 nL/spot dialyzed PNGase F or buffer control arrays with 250 μm spacing. DHB (20 mg/ml) was sprayed onto the sections and MS spectra were acquired by oversampling at 100 μm intervals using a MALDI-TOF/TOF MS instrument. Monoisotopic glycan masses were measured in the positive ion reflectron mode as (M+Na) adducts. Panel A shows the log ion intensity map for the m/z 933.3 of a pauci mannose structure was observed to be localized and relatively highly expressed in the adipose tissue region of the FFPE tissue. The agalactosylated bisecting structure of m/z 1339.4 was observed only in the necrotic tissue of the sample P1. Five high mannose structures (m/z 1257.4, 1419.4, 1581.5, 1743.4, and 1905.6) were observed predominantly in the tumor region as shown in panel B. The hybrid/complex N-glycan structures were indicative of the stroma region as shown in panel C (m/z 1501.5, 1663.5, 1485.4, 1809.6, 1647.6, 1850.6, 2012.7, and 2174.7) and the sialylated structures are represented in panel D shows log ion intensities of the sialylated glycans of m/z 1954.6, 2245.7, 2100.7, and 2391.8.

