
Fig. 8.
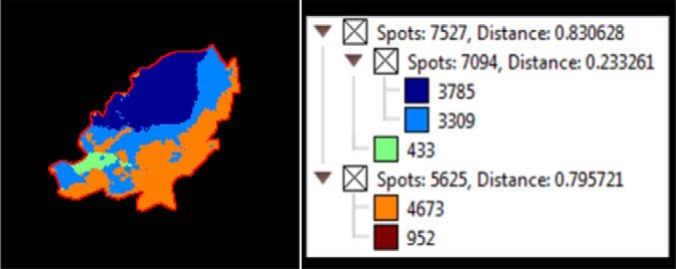
MALDI imaging MS of N-linked glycans released from formalin-fixed ovarian cancer sections. Formalin-fixed ovarian cancer sections were treated with antigen retrieval prior to printing of (30 nL/position) dialyzed PNGase F or buffer control arrays with 250 μm spacing. DHB (20 mg/ml) was sprayed onto the sections and MS spectra were acquired by oversampling at 100 μm intervals using a MALDI-TOF/TOF MS instrument. Data was loaded raw into SCiLS, pre-processed for baseline subtraction and normalization to total ion current (TIC) prior to segmentation analysis (maximum processing mode, interval width of 0.5 Da, strong smoothing). The segmentation map for the entire data set of patient P1 discriminates between tumor (dark blue), stroma (light blue), adipose (orange) necrotic (green) and tissue border (brown) of the sections at the segmentation levels selected (see insert). The dendrogram (Fig. insert) shows the number of spectra clustered together for each region.