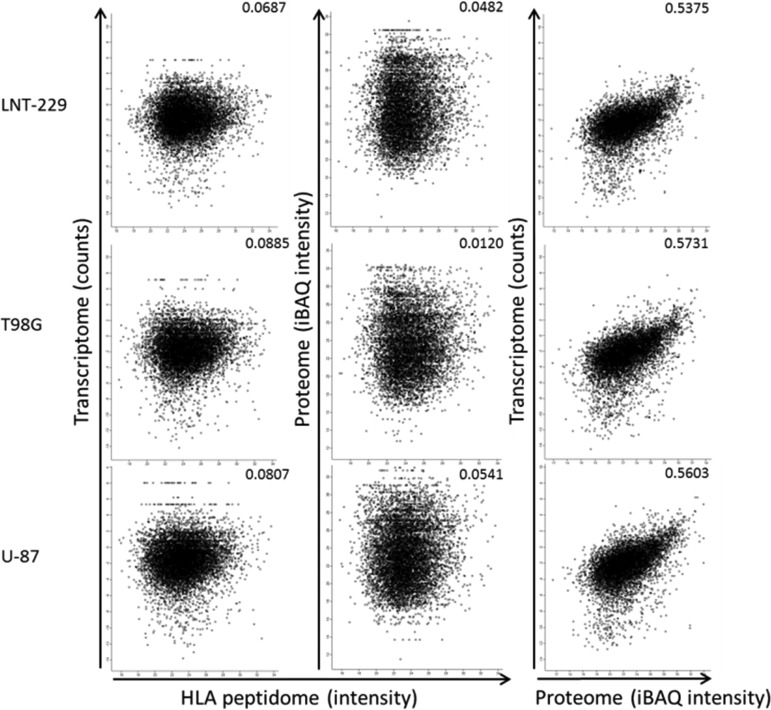
Fig. 3.
Comparisons between the transcriptomes, proteomes and HLA peptidomes of the three GBM cell lines. The iBAQ intensities (69) of the proteomes were defined by the MaxQuant software (52). The normalized intensities of the transcriptomes (i.e. the number of identified reads divided by the length of the transcript) were used for the calculations. Pearson correlations are indicated in each panel.

