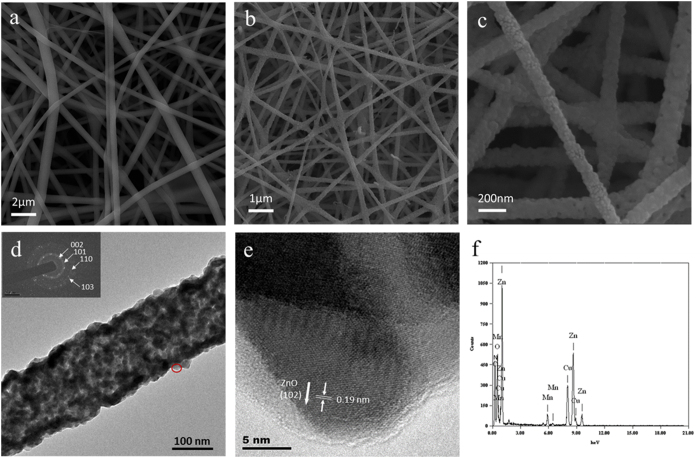
Figure 1.
SEM images of (a) as-spun 15% Mn2+-doped ZnO nanofibers, (b) after annealing at 550 °C for 1 h in N2, (c) enlarged view of the annealed nanofibers. (d) TEM image of 15% Mn2+-doped ZnO nanofibers. The inset shows the SAED pattern. (e) HRTEM image taken from the nanofiber indicated by the ellipse in (d). (f) EDS spectra from the single nanofiber.

