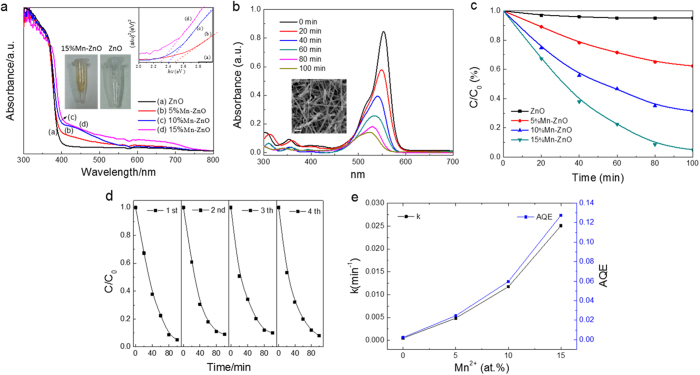
Figure 3.
(a) UV−vis diffuse reflectance spectra (DRS) of undoped and Mn2+-doped ZnO fibers. The inset shows the corresponding plots of (αhν)2 versus photon energy (hν). (b) UV-vis absorption spectra of RhB at different time in the presence of 15% Mn2+-doped ZnO nanofibers under visible light. The inset illustrates the SEM image of the specimen reclaimed after photocatalytic measurement. (c) Photodegradation of RhB by ZnO nanofibers doped with different Mn2+ concentration. (d) Cycling tests of photodegradation of the specimen. (e) Degradation rate constants and apparent quantum efficiencies of ZnO nanofibers with different doping concentrations.

