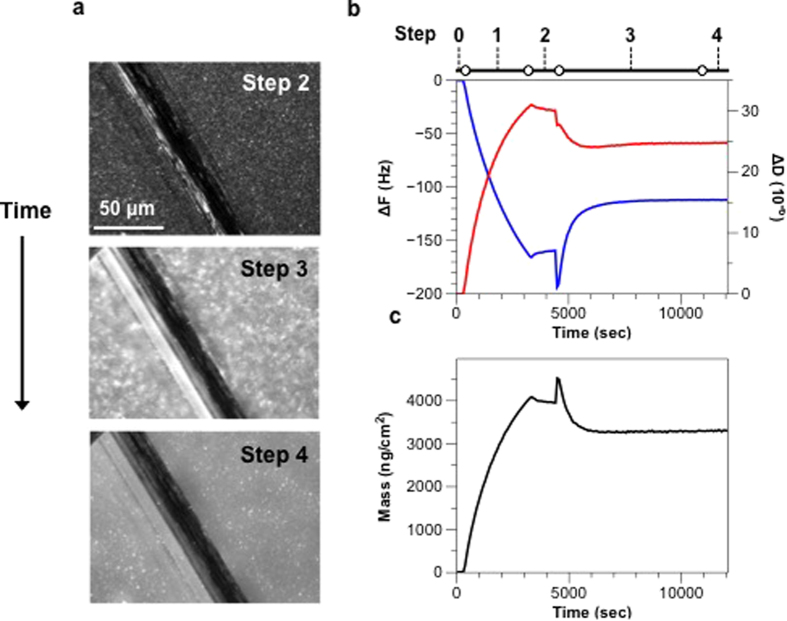
Figure 1.
(a) The microscopy images showing the formation process of OM-SBs. OMVs were labeled with lipophilic fluorophore, R18, and PEG-liposomes were devoid of fluorescence. The dark lines in the images are scratches intentionally made to find the focal plane of bilayer. Intact OMVs labeled with R18 first adsorbed on the glass substrate (corresponding to step 2 in b). After the addition of PEG-liposomes, OMVs were induced to rupture (step 3), which resulted in the diffusion of R18 fluorophores from OMVs to newly formed bilayers (b step 3). The uniform distribution of the fluorescence indicated the contiguous nature of the OM-SB as well as the mobility of the R18 within it (step 4). The images were all taken under 40x magnification. A time-lapse movie of this rupture process can be found in the Supplemental Information. (b) Typical QCM-D curves showing the formation process of OM-SB. After initial PBS buffer baselines were achieved (0), OMVs were flowed into the chamber and adsorbed on the sensor (1). This step was followed by a PBS buffer rinse to remove excess OMVs not absorbed to the surface (2). PEG-liposomes were then sent into the system (3), which formed SLB patches and induced adsorbed OMV rupture. A final buffer rinse was made to remove any excess amount of vesicles from the system (4). (c) Frequency and dissipation signals were converted to adhered mass values, as shown in the lower plot. Changes in the mass on the surface along the formation process were determined using the one-layer Voigt-Voinova model (Supplemental Information).

