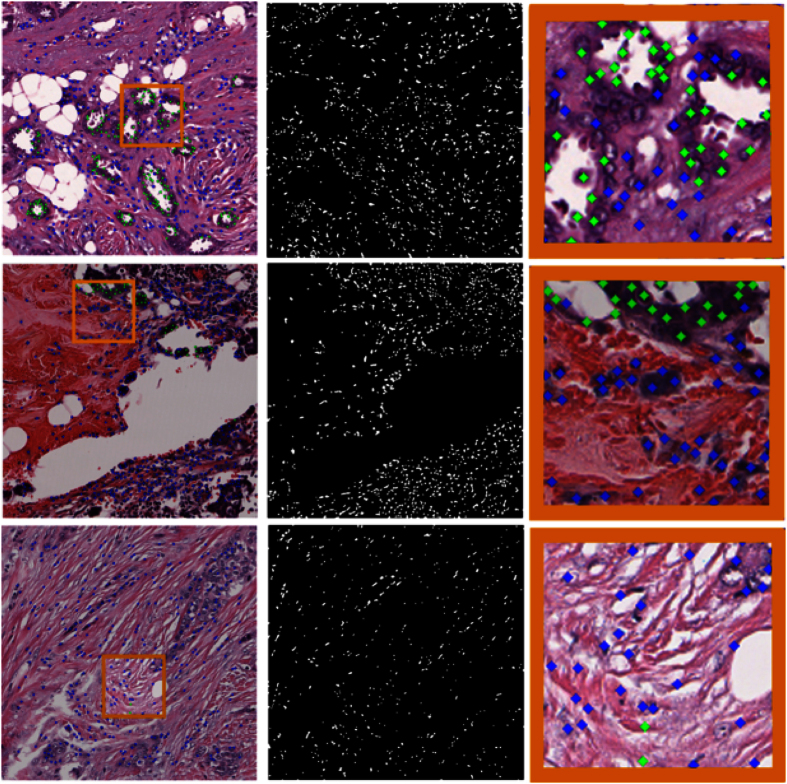
Figure 6. Tubule nuclei identification process for high power fields extracted from low ODX (top row), intermediate ODX (middle row) and high ODX (bottom row) breast cancers.
In the first column, the high power field at x20 magnification is depicted. In the second column, the resulting mask showing the nuclei centroids after the nuclei detection process is presented. The third column shows the DNN classification of each nucleus either as a tubule nucleus (green dot) or a non-tubule nucleus (blue dots). Each image in the right column corresponds to a close up in the selected region (orange rectangle) depicted in the left most column. For the low ODX high power field, a significant number of tubule nuclei are identified. Observe also that some false negatives are not uncommon in the nuclei surrounding the tubule lumen. On the other hand, the high and intermediate cases have a substantially lower number of tubule nuclei. Some false positive (false tubule nuclei) errors are also visible in the right most column.

