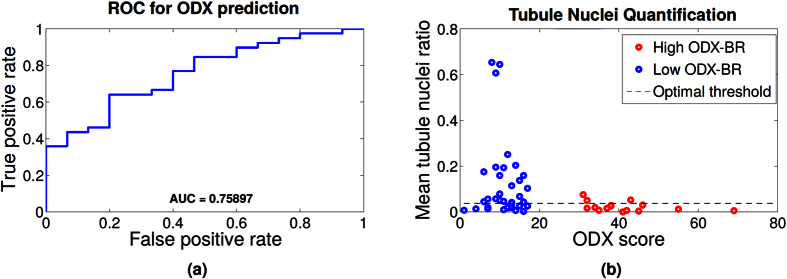
Figure 8.
(a) Receiver operating characteristic (ROC) curve for the prediction of low ODX using only the tubule nuclei ratio feature. (b) Mean automated tubule nuclei ratio for each whole slide image. The high (red) and low (blue) ODX score groups are depicted. The x-axis represents the underlying ODX score of each sample. The y-axis represents the tubule nuclei ratio. Observe that the high ODX image have a low tubular density. A high tubule nuclei ratio is very likely associated with a low ODX image. Optimal threshold obtained for the ROC curve (threshold at which the ROC curve is closest to point [0, 1]) is also shown.

