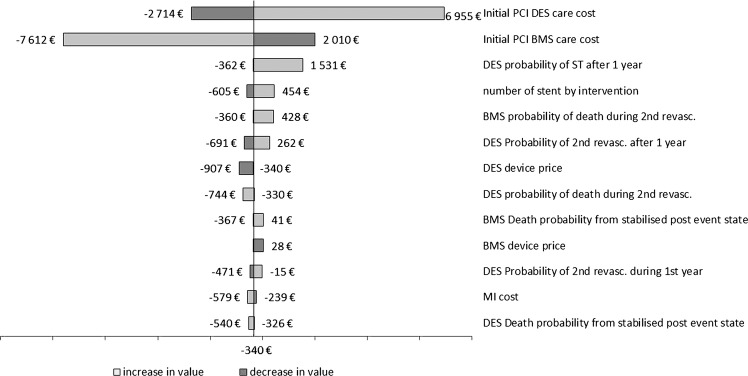
Figure 2.
Tornado diagram of one-way deterministic sensitivity analysis. Numbers are the estimated ICER when changing parameter value to a maximal value (light grey) or a minimal value (dark grey). Only parameters giving variation above €200 are shown. BMS, bare-metal stent; DES, drug-eluting stent; ICER, incremental cost-effectiveness ratio; MI, myocardial infarction; PCI, percutaneous coronary intervention; ST, stent thrombosis.

