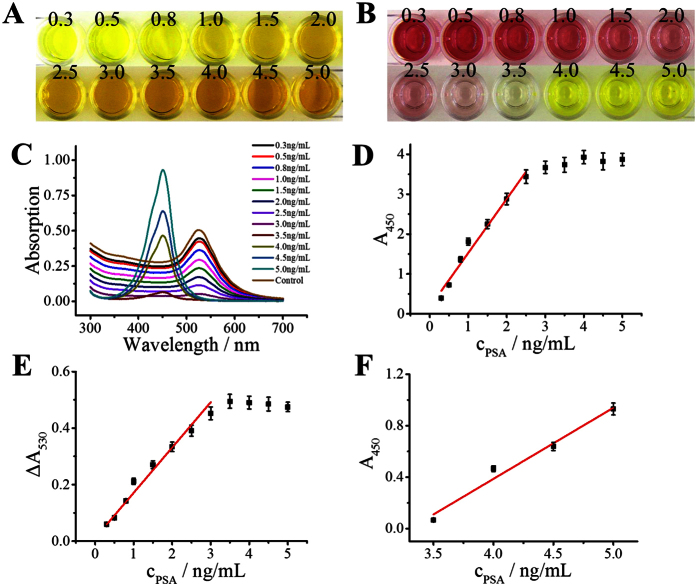
Figure 6. Compare between traditional ELISA and this dual-color ELISA.
(A,B) were the photos of traditional ELISA and this dual-color ELISA in detection of PSA; (C) UV-vis spectrum of this dual-color ELISA; (D) calibration curve of the traditional ELISA; (E,F) were the calibration curve of wine red section and yellow section which monitored separately by the changes of absorption value at 530 nm (ΔA530) and absorption value at 450 nm (A450), respectively. Error bars represent standard deviations of three replicates.

