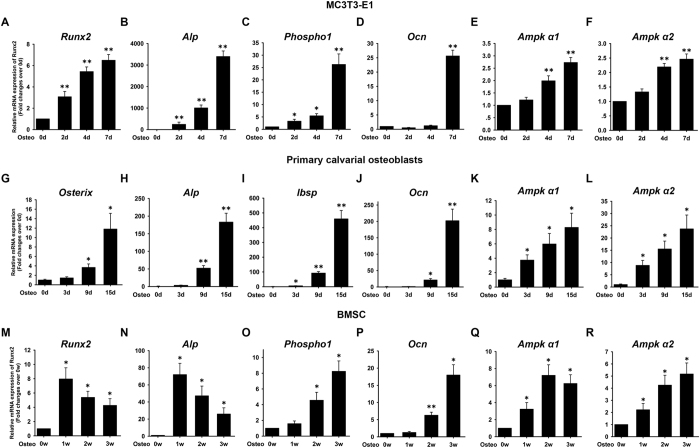
Figure 1. mRNA expression of AMPK α1 and α2 subunits during osteogenesis in MC3T3-E1, primary calvarial osteoblasts and mouse BMSCs.
MC3T3-E1, primary osteoblasts and BMSCs were induced to osteogenic differentiation. The expression of Runx2 (A,M), Osterix (G), Alp (B,H,N), Phospho1 (C,O), Ibsp (I) Ocn (D,J,P), Ampk α1 (E,K,Q) and Ampk α2 (F,L,R) was evaluated by qRT-PCR. β-actin was used as internal control. The results are expressed as fold changes in mRNA abundance relative to 0d or 0w. Data are shown as mean ± SD. *P < 0.05; **P < 0.01, vs. 0d or 0w.

