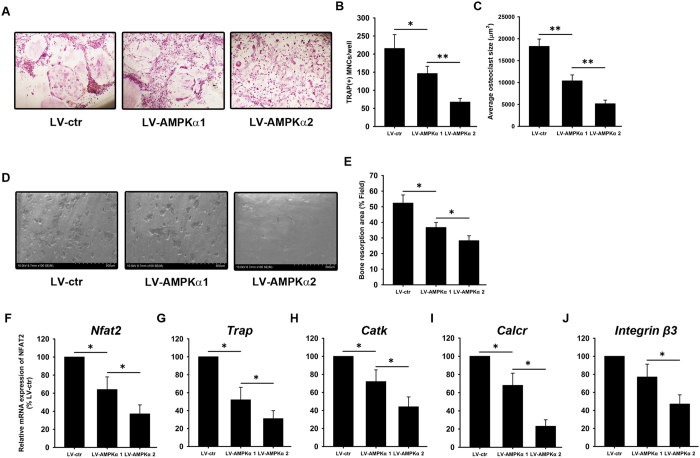
Figure 5. Osteoclastogenesis in bone marrow monocytes induced by AMPK α1- and α2-expressing MC3T3-E1 cells.
Bone marrow monocytes were co-cultured with LV-AMPKα1 and LV-AMPKα2 MC3T3-E1 cells in the presence of BMP2. On day 7, cells were assessed by TRAP staining (A) followed by quantification of TRAP + monocytes (MNC) (B) and average osteoclast size (C). Osteoclast function was assessed by osteoclast cultures on bone slice followed by SEM imaging (D). Percentage of resorption area was measured (E). qRT-PCR was performed to evaluate the mRNA expression of Nfat2 (F), Trap (G), Catk (H), Calcr (I), and integrin β3 (J). β-actin was used as an internal control. Data are shown as mean ± SD. *P < 0.05, **P < 0.01.

