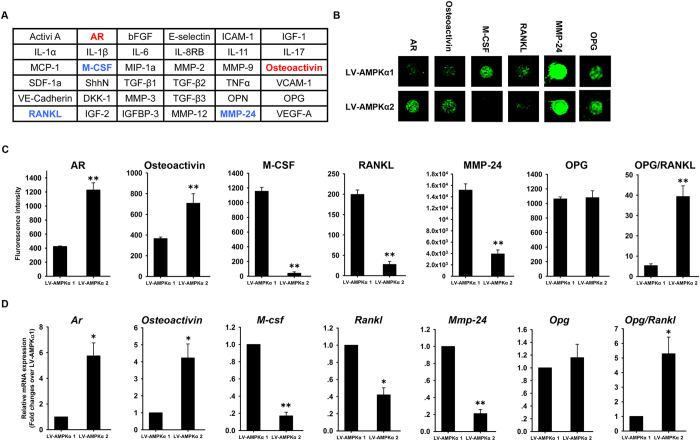
Figure 6. Secretion of proteins involved in bone metabolism from MC3T3-E1 cells expressing AMPK α1 and α2.
The levels of 36 proteins were measured using a high throughout antibody array and are shown as upregulation (red) or downregulation (blue) in α2-AMPK vs. α1-AMPK MC3T3-E1 cells (A). Fluorescent signals (B) and fluorescence intensity (C) corresponding to AR, osteoactivin, M-CSF, RANKL, MMP24 and OPG were measured in MC3T3-E1 cells expressing α1- and α2-AMPK. The mRNA expression of AR, osteoactivin, M-CSF, RANKL, MMP24 and OPG in MC3T3-E1 cells expressing α1- and α2-AMPK was evaluated by qRT-PCR (D). β-actin was used as an internal control of qRT-PCR. Data are shown as mean ± SD. *P < 0.05, **P < 0.01.

