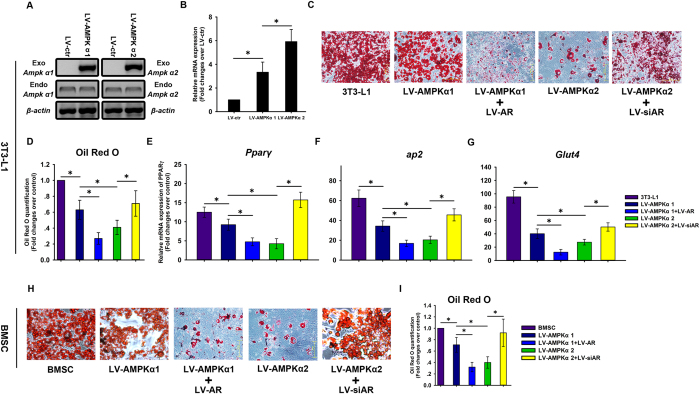
Figure 8. Adipogenesis in 3T3-L1 and mouse BMSCs expressing AMPK α1 and α2 subunits.
LV vectors expressing AMPK α1 and α2 subunits were used to infect 3T3-L1 cells, and positive clones were selected with puromycin. An empty LV vector served a control (LV-ctr). The expression of exogenous and endogenous AMPK α1 and α2 was evaluated by RT-PCR (A). AR mRNA expression level was evaluated by qRT-PCR (B). β-actin was used an internal control. Adipogenesis was induced in infected cells in which AR was overexpressed (LV-AR) or knocked down (LV-siAR), and Oil Red O staining (C) and quantification (D) was used to assess the presence of fat droplets. The mRNA expression of the adipogenesis markers Pparγ (E), aP2 (F), and Glut4 (G) was evaluated by qRT-PCR. Adipogenesis was induced in mouse BMSCs overexpressing AMPK α1 and α2 in which AR was overexpressed (LV-AR) or knocked down (LV-siAR), and Oil Red O staining (H) and quantification (I) was used to assess the presence of fat droplets. Data are shown as mean ± SD. *P < 0.05.

