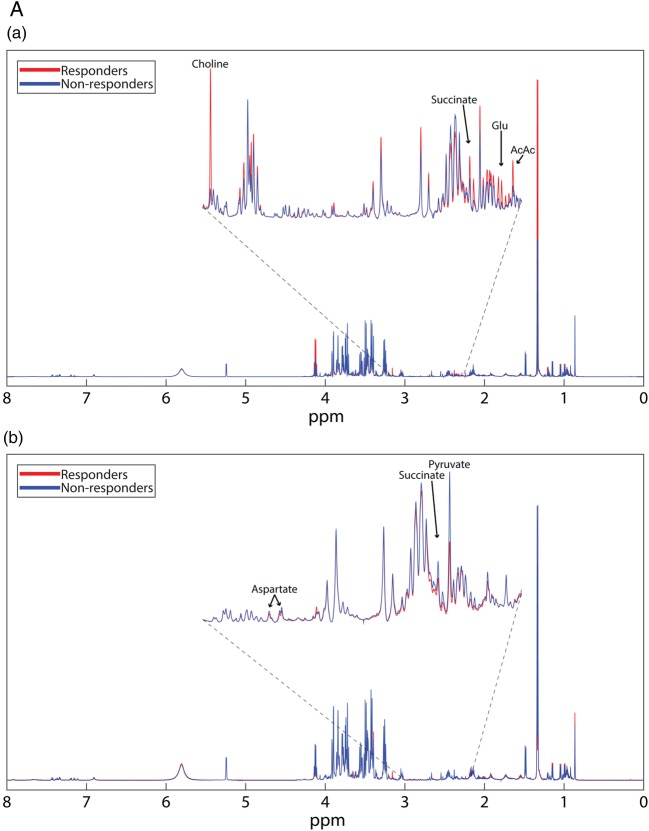
Figure 1.
(A) Mean NMR spectra of patient sera show differences in metabolite intensities between responders and non-responders before (a) and 6 months after (b) treatment with rituximab. Variations in metabolite concentrations between groups indicate unique metabolite profiles between responders and non-responders at both time points. Labelled peaks indicate significant metabolites. (B) Concentrations of specific polar metabolites are different between rituximab responders and non-responders. The mean concentrations (±SD) of sera polar metabolites of patients with RA measured by 1H-NMR before (a) and after (b) treatment with rituximab (lactate excluded due to scale). These metabolites represent a group of potential biomarkers for predicting and assessing patient response to rituximab treatment. *p<0.1 **p<0.05. AcAc, acetoacetate; Glu, glutamate; NMR, nuclear magnetic resonance; RA, rheumatoid arthritis.

