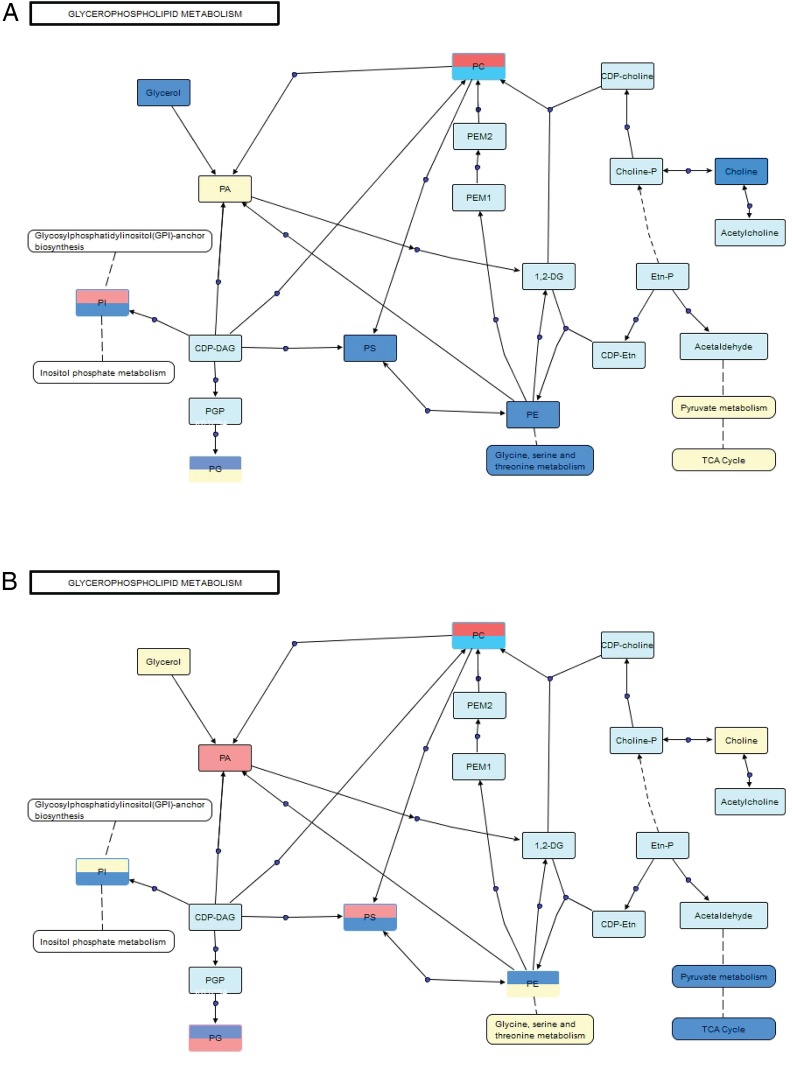
Figure 3.
Glycerophospholipids and related metabolites are differentially expressed in sera from patients with RA before (A) and after (B) treatment with rituximab. Pathway map connects related classes of compounds based on biological activity. Blue indicates classes that are downregulated in responders, red indicates classes that are upregulated in responders, yellow is no significant difference and light blue indicates not detected. Split boxes represent standard ester linkage glycerophospholipids on the top and alkyl ethers on the bottom. CDP, cytidine diphosphate; CDP-Etn, CDP-ethanolamine; Etn-P, phosphoethanolamine; PA, phosphatidic acids; PC, phosphatidylcholines; PE, phosphatidylethanolamines; PEM1, phosphatidyl-N-monomethylethanolamine 1; PEM2, phosphatidyl-N-monomethylethanolamine 2; PG, phosphatidylglycerols; PM1, phosphatidyl monomethylethanolamine; PS, phosphatidylserines; TCA, tricarboxylic acid.

