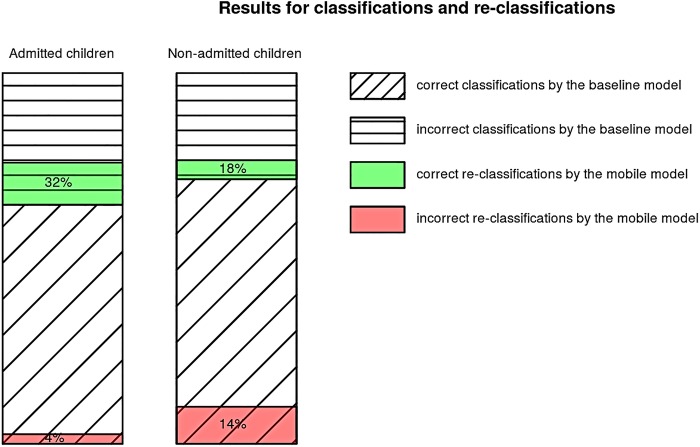
Figure 4.
Admitted and non-admitted children classification results using ‘baseline’ and reclassification results using the ‘mobile’ model. The height is proportional to the percentage of each classification or reclassification (correct reclassification is represented in green and incorrect reclassification in red).

