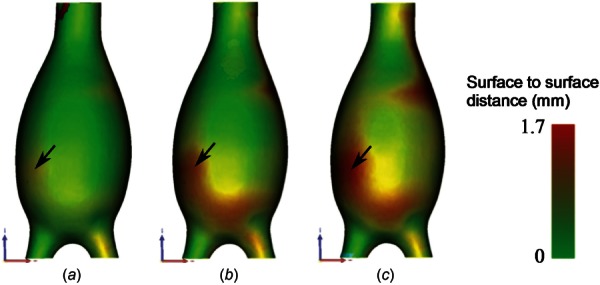
Fig. 7.

Qualitative visualization of the distance distribution between the predicted unloaded geometry () estimated from the three pressurized states (80 mm Hg (a), 120 mm Hg (b), and 140 mm Hg (c) gauge) and the actual unloaded geometry (UG). The maximum distance was obtained along the distal anterior wall for all three loading conditions (see black arrow), and it is evident that higher pressures lead to larger distances between the surfaces.
