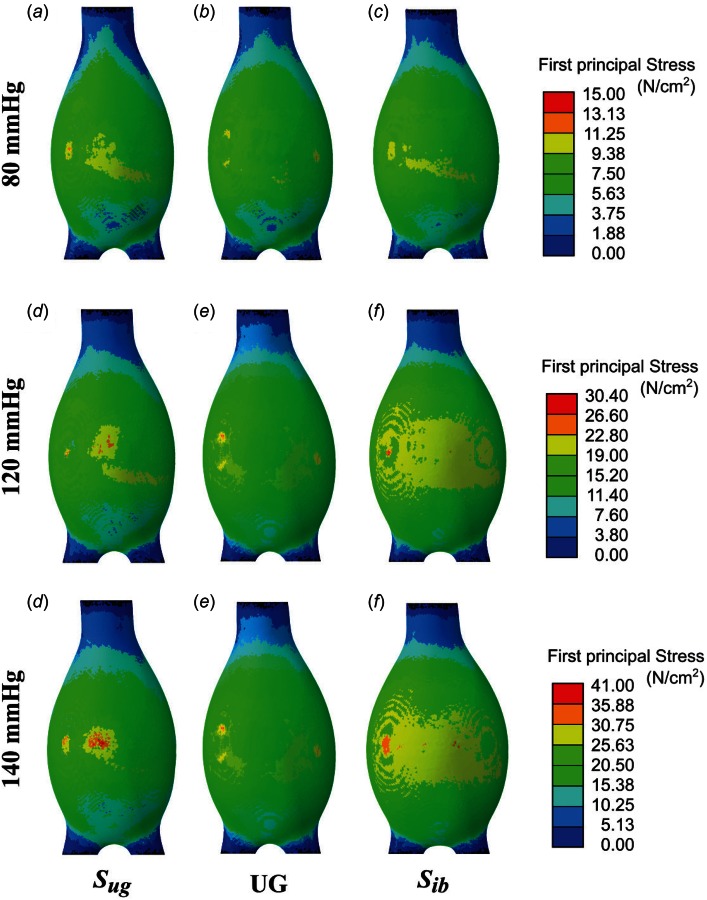
Fig. 8.

Comparison of the predicted unloaded geometry () ((a), (d), and (g)), the actual unloaded geometry (UG) ((b), (e), and (h)), and the μCT image-based geometry () ((c), (f), and (i)) of the AAA phantom based on the first principal stress distribution. The applied intraluminal pressure was equivalent to 80 mm Hg for (a)–(c); 120 mm Hg for (d)–(f); and 140 mm Hg gauge for (g)–(i).
