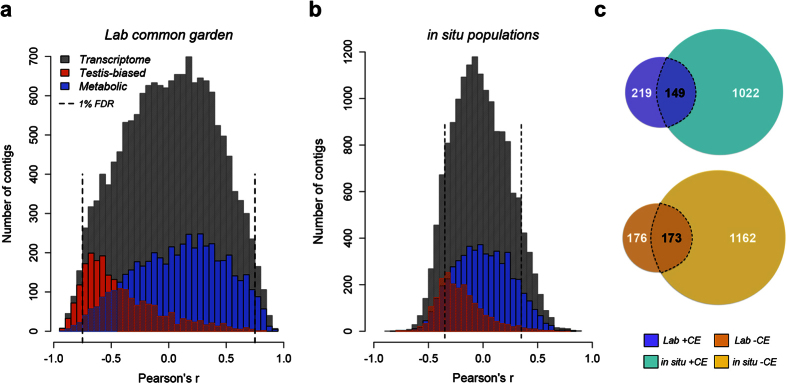
Figure 1. Clinal expression in Drosophila subobscura populations along the European latitudinal transect.
(a,b) Distributions of correlation coefficients (Pearson’s r) between RNA-seq normalised reads and latitude for all the transcripts in the de novo transcriptome assembly (grey bars), putative testis-biased (red bars) and metabolic (blue bars) transcripts in six D. subobscura populations reared in two non-thermally stressful environmental conditions: lab common garden (a) and outdoor in situ (b). Positive r values denote transcripts with higher expression at higher latitudes, negative r values denote genes with higher expression at lower latitudes. The lab common garden and in situ datasets consist respectively of 15779 and 15947 total transcripts (grey bars), of which 1714 and 1680 are putative testis-biased (red bars) and 5257 and 5323 are metabolic homologs (blue bars). See Methods for how metabolic and testis-biased transcripts were classified. (c) Overlap between transcripts showing significant clinal expression (1%FDR, dashed lines in a,b) in the lab and in situ conditions; +CE = positive clinal expression, −CE = negative clinal expression.

