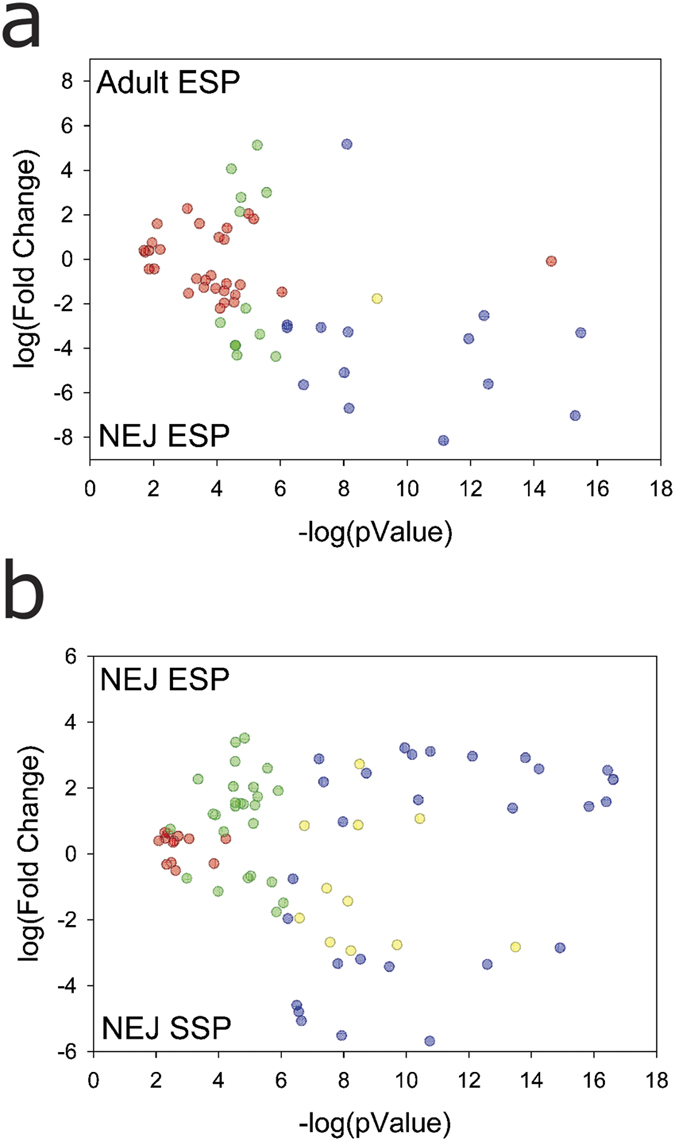
Figure 3. Volcano plot showing differentially expressed proteins.

The volcano plot shows the results of differentially expressed proteins based on fold change versus t-test probability. (a) Plot obtained with the proteomic approach when comparing F. hepatica-derived proteins identified in E/S products from NEJ stage (NEJ ESP) with E/S products from the adult stage (Adult ESP) and (b) F. hepatica-derived proteins identified in E/S products from NEJ stage (NEJ ESP) with the somatic NEJ soluble proteins (NEJ SSP). Each protein is represented as a dot and is mapped according to its fold change on the ordinate axis (y) and t-test p-value on the abscissa axis (x). Proteins are represented by: (blue dot) if had an identification that satisfied both fold and statistical criteria; (yellow dot) had an identifications that was filtered out by the L-stringency; (green dot) had an identification satisfied the fold criteria but, most likely, this happened by chance; and (red dot) had identification did not meet the fold and p-value criteria.
