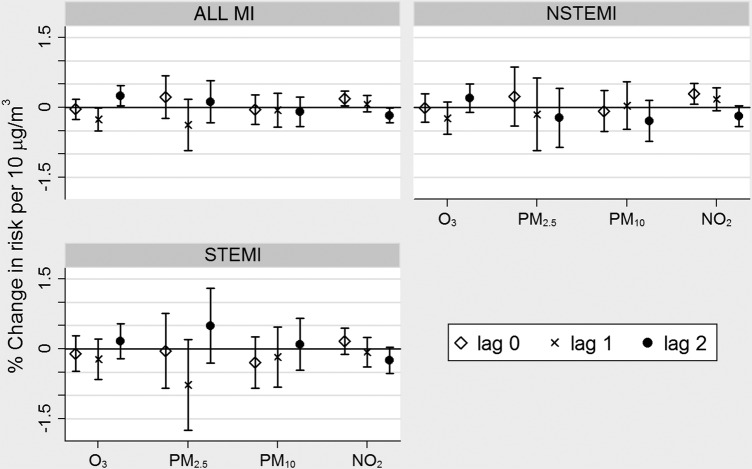
Figure 1.
Associations between atmospheric chemistry transport model pollution concentrations at lags 0, 1 and 2 and myocardial infarction (% change in risk per 10 µg/m3 increase in pollutant). Pollutant metrics: daily mean PM2.5, daily mean PM10, daily maximum 1-hour NO2, daily maximum 8-hour mean O3.

