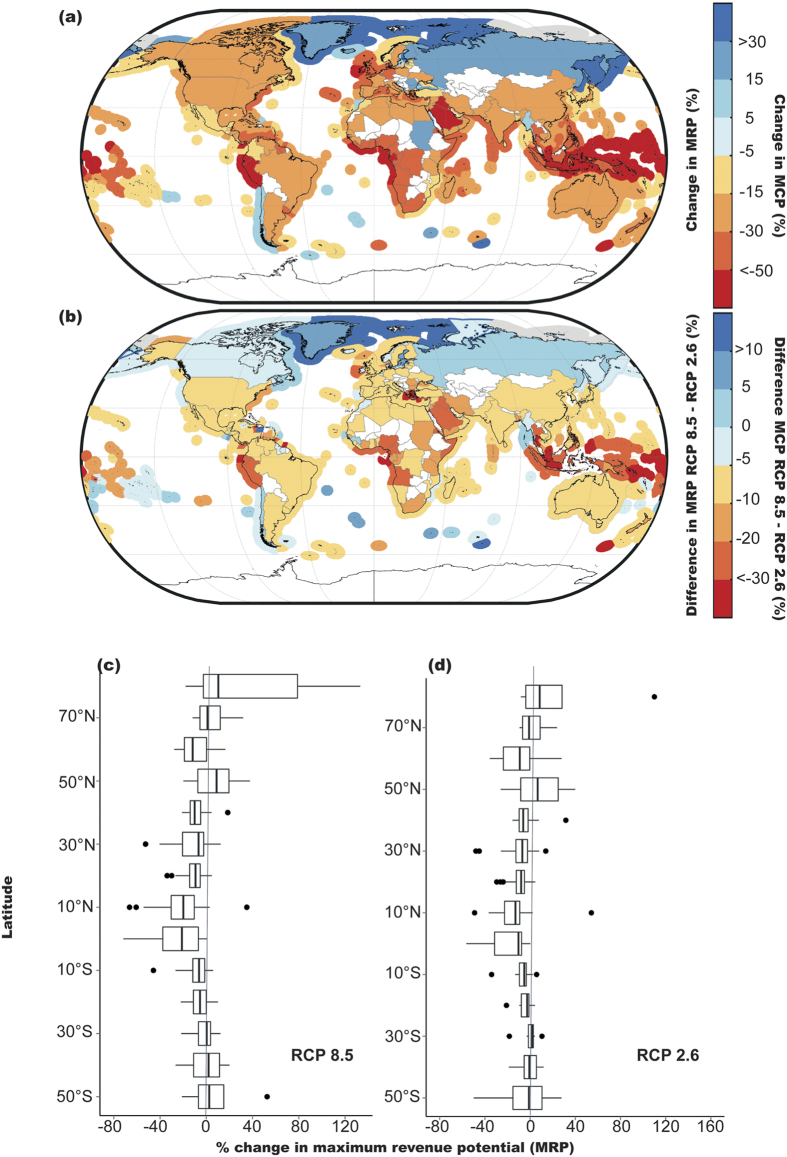
Figure 1.
Impacts of climate change on MCP and MRP by the 2050 s (average between 2041–2060) relative to the 2000 s (average between 1991–2010): (a) mean percentage change in projected maximum catch potential (MCP) of 280 Exclusive Economic Zones (EEZs) and mean percentage change in projected MRP of 192 fishing nations in the 2050 s relative to the level in the 2000 s under RCP 8.5 scenario; (b) differences in percentage change in MCP and MRP between RCP 8.5 and RCP 2.6 scenarios in the 2050 s; (c,d) latitudinal zonal average of mean percentage change in fisheries MRP in different fishing countries under RCP 8.5 (c) and RCP 2.6 (d).

