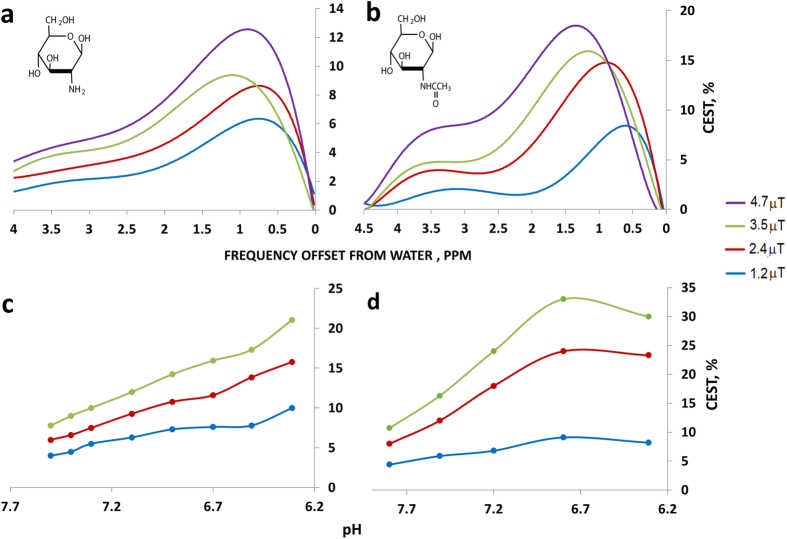
Figure 1. Radiofrequency (RF) saturation field (B1) and pH dependencies of CEST contrast in 20 mM GlcN sulfate and GlcNAc solutions (containing 10 mM PBS and 10% D2O) at a temperature of 37 °C at 11.7 T.
(a,b) CEST plots as a function of the offset at pH = 7.4. (c,d) The pH dependencies of the CEST of GlcN sulfate and GlcNAc solutions, respectively, at an offset of 1.2 ppm from the water signal.

