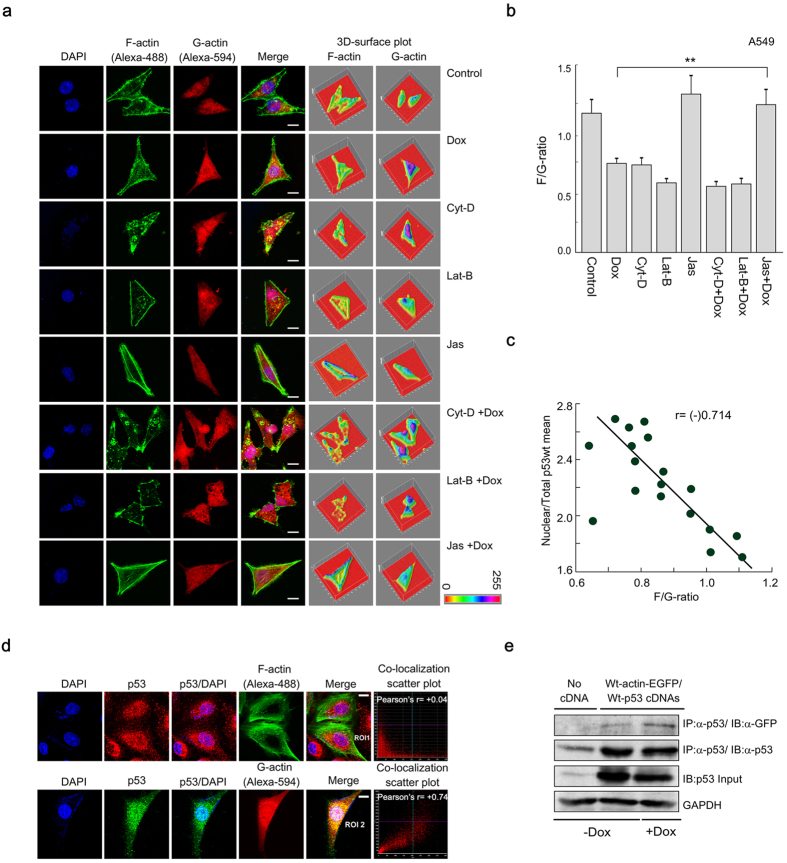
Figure 2. Nuclear translocation of p53 is negatively-correlated with the shift in F/G-actin ratio.
(a) Confocal images showing the distribution of F- and G-actin in different drugs-treated conditions. F- and G-actin were stained with Alexa-488-tagged phalloidin and Alexa-594-tagged DnaSe1 respectively. Nucleus was stained with DAPI. Magnification 60×. 3D-surafce plots show the respective distribution of F- and G-actin. Scale bar: 10 μm. (b) Bar diagram of F-/G-actin ratios in the different drugs-treated conditions in A549 cells. (c) Scatter plot showing negative-relationship between nuclear/total p53 and F/G ratios. The solid line shows the best line fitted to the data based on the simple regression model. The correlation coefficient (r) was mentioned in the graph. (d) Colocalization between p53 and F-actin/G-actin in A549 cells. p53 was stained with Alexa-546/-488-tagged p53 (DO-1) antibody. F-/G-actin were directly stained with Alexa-488-tagged phalloidin or Alexa-594-tagged DnaSe1 respectively. Nucleus was stained with DAPI. Image magnification: 60×. Scale bar: 10 μm. Pearson’s colocalization correlation(r) between red and green channels is presented in colocalization scatter plots. (e) A549 cells were co-transfected with EFGP-tagged wild-type actin and wild-type p53. p53-associated proteins were pulled-down with p53 antibody and Western blotted with anti-GFP and anti-p53 antibodies. GAPDH was used as internal loading control. Data are representative or as the mean ± SEM and are the cumulative results of five independent experiments (n = 25), *p < 0.05, **p < 0.01, ***p < 0.001.

