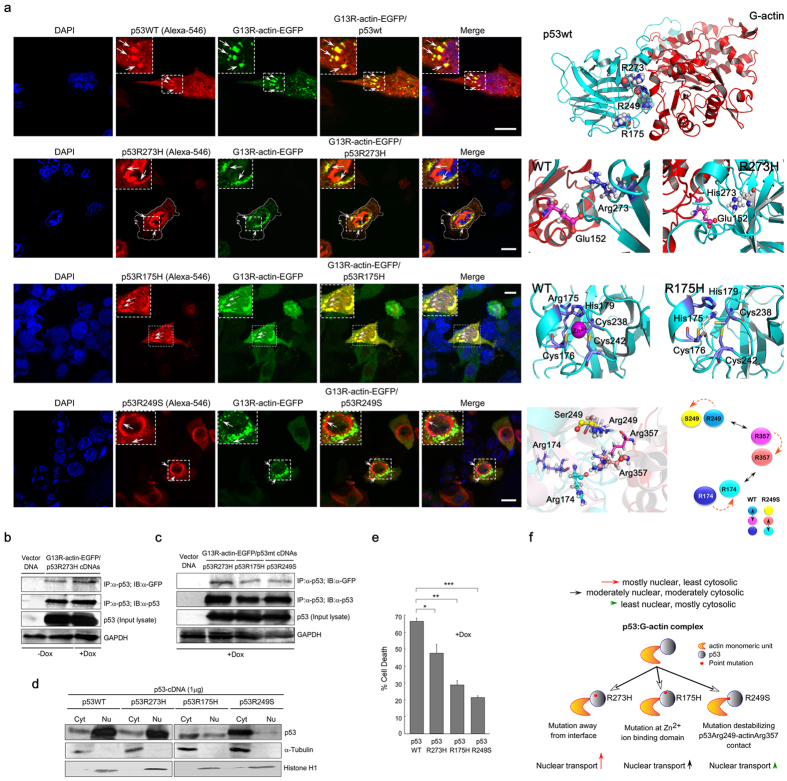
Figure 5. Degree of physical interaction between p53-mutants and G-actin dictates subcellular-localization of p53.
(a) Colocalization of p53WT/p53R273H/p53R175H/p53R249S with G13R-actin-EGFP upon co-transfection in p53-null H1299 cells. Wild-type and mutant p53 were stained with Alexa-546-tagged anti-p53 antibody. Nucleus was stained with DAPI. The colocalized yellow pixels in the merge images are indicated with arrowheads. Image magnification: 60×. Scale bar: 10 μm. Cartoon representation of post-simulated p53:G-actin complex is shown in the right panels, showing the position of point mutations (p53) in each case (in spheres/sticks). Wild-type p53 is at the left side and mutant p53 is at the right side of right panels. For p53R249S, super-imposition of post-simulated p53:G-actin models (WT versus R249S) are shown in the bottom panels, showing the position of amino acid residues. A cartoon is shown depicting the amino acid shifts, where colored circles represent amino acid residues specified at left. Dotted-lines indicate the shifting of amino acid residues in R249S mutant. Double-headed arrows indicate the interaction between amino acids. Physical interaction between G13R-actin and p53-mutants, (b) p53R273H and (c) p53R273H/p53R175H/p53R249S, were performed by co-immunoprecipitation (with anti-p53 antibody) and Western blot (with anti-GFP antibody) assays. GAPDH has been used as the internal loading control. (d) Cytosolic and nuclear lysates from ectopically wild-type/mutant p53-expressing HCT116 (p53−/−) cells were Western blotted to analyze the subcellular distribution of p53. Tubulin and Histone-3 have been used as cytosolic and nuclear loading control. Data are representative of three independent experiments. (e) Percent cell death in p53-null cells upon over-expression of wild-type/mutant p53. Data are representative as the mean ± SEM and are the cumulative results of five independent experiments, *p < 0.05, **p < 0.01, ***p < 0.001. (f) Schematic diagram showing the basis of altered subcellular localization of mutant p53. Colored arrows lengths indicate the respective degree of nuclear localization of mutant p53.

