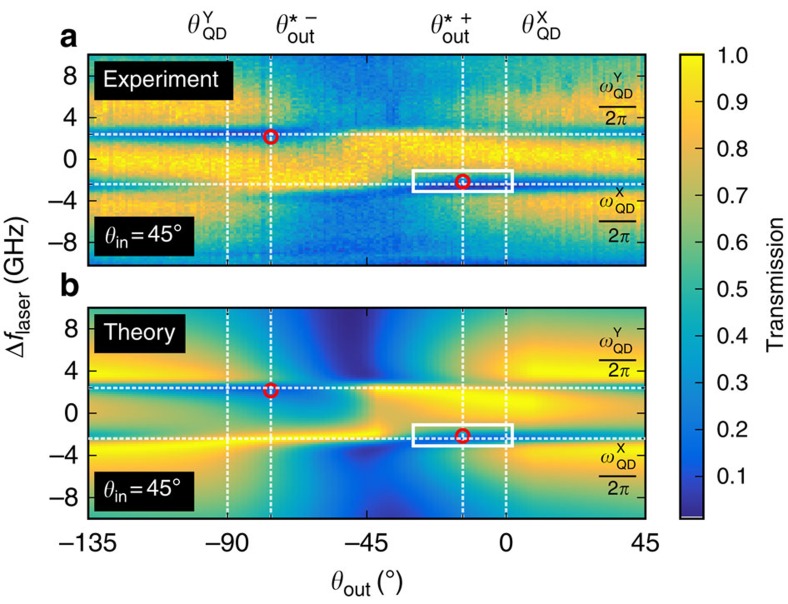
Figure 2. Coherent probing of the QD cavity system.
Experimental (a) and theoretical (b) false colour plot of the columnwise normalized optical transmission as a function of the laser detuning ΔfLaser and the polarization θout (θin=45°). The fine-split QD transition frequencies are at  GHz and
  GHz. The red circles indicate the special polarization conditions; the white square indicates the area explored in Fig. 3.

