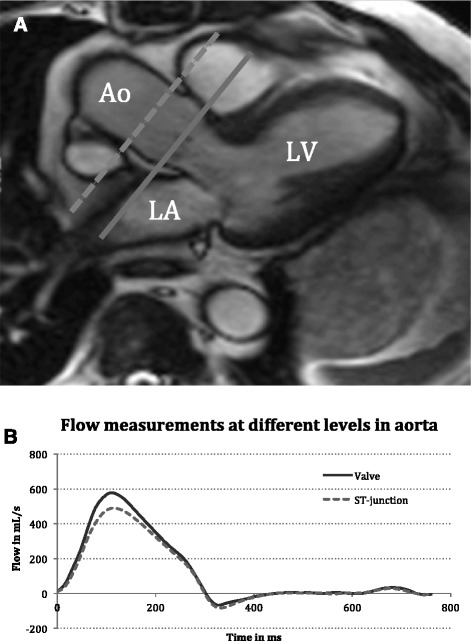
Fig. 1.

Example of flow measurements in a patient. Panel a illustrates placement of imaging planes at the ST-junction (dashed line) and at valve level (solid line). Panel b shows the resulting flow curves for the two different imaging planes. Ao aorta, LV left ventricle, LA left atrium, ST sinotubular, mL millilitres, s seconds, ms milliseconds
