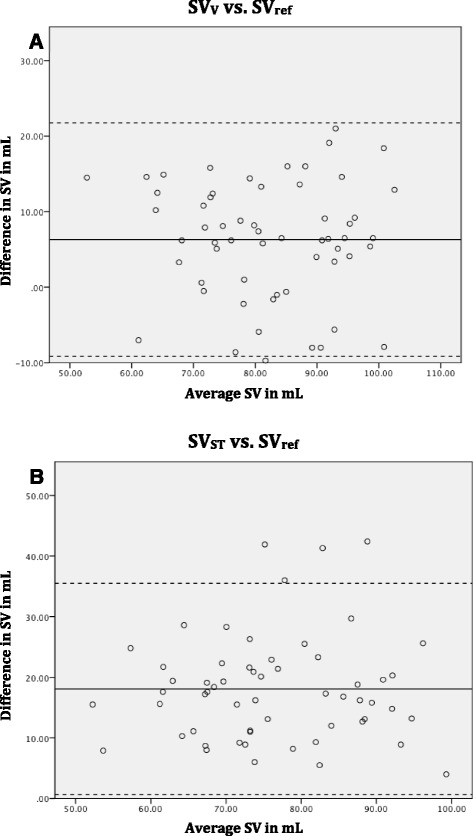
Fig. 5.

Bland Altman plot. The continuous line represents the mean (bias) and the dotted lines represent the 95 % limits of agreement for a Stroke volume measured with flow at valve level (SVV) compared to volumetric method (SVref) b Stroke volume measured with flow at the sinotubular junction (SVST) compared to volumetric method (SVref). SV stroke volume, mL millilitres
