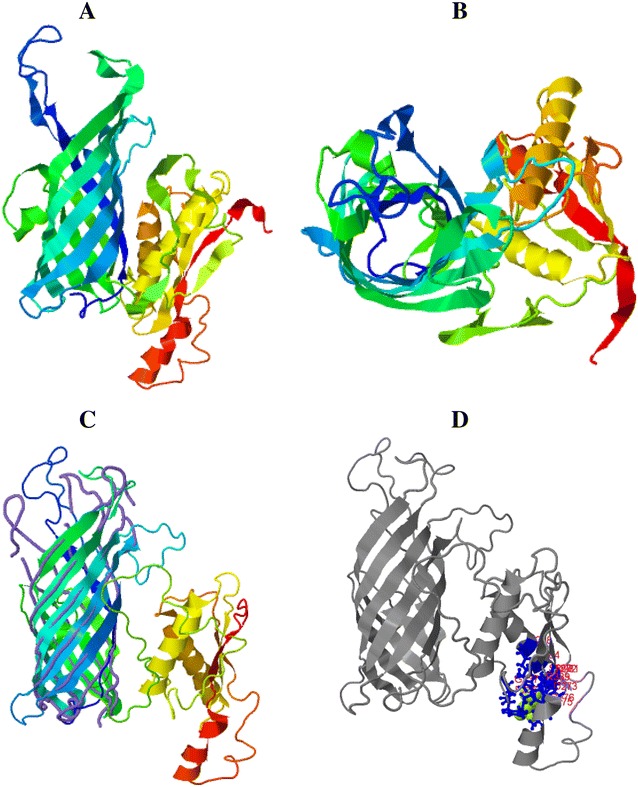
Figure 6.

3-D model for MhHM in I-Tasser server with a C-score of −3.56. A Lateral view in rainbow ribbon diagram. B Top view of the rainbow ribbon diagram. C Alignment between the close structure OmpA transmembrane domain of E. coli, which is represented by purple lines, and MhHM, in the rainbow ribbon diagram. D Prediction of the ligand binding site; the consensus binding residues of OmpA-like domain of A. baumannii are represented by blue sticks and MhHM in gray color diagram (before as rainbow ribbon).
