
Figure 7.
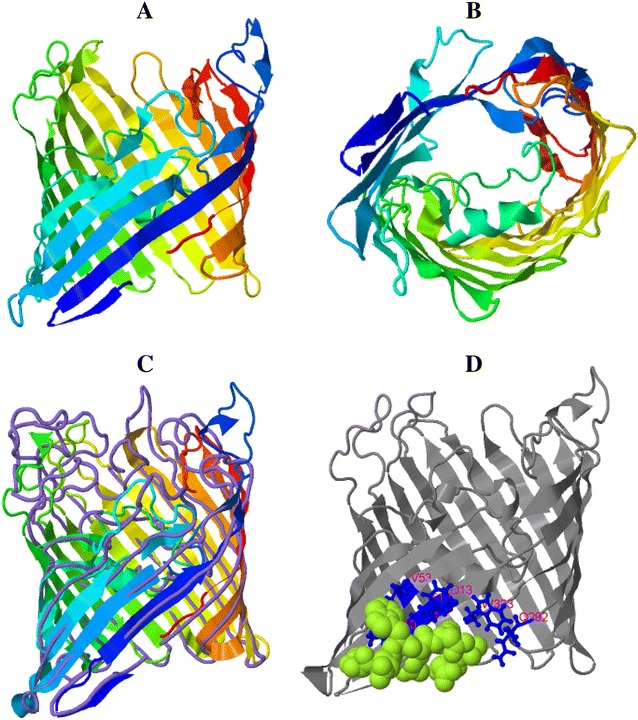
3-D model for MhMP in I-Tasser server with a C-score of 1.02. A Lateral view in rainbow ribbon diagram. B Top view of the rainbow ribbon diagram. C Alignment between the close structure OmpC of E. coli, which is represented by purple lines, and MhMP by the rainbow ribbon diagram. D Prediction of ligand binding site; the consensus binding residues of Omp 38 of Delftia acidovorans are represented by blue sticks and the ligand malate by green spheres. MhMP in gray color diagram (before as rainbow ribbon).