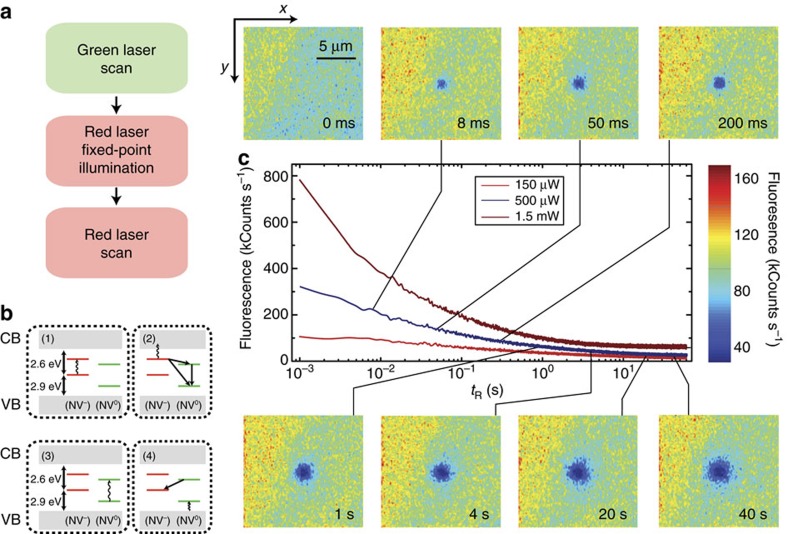
Figure 1. Red-light-induced bleaching of the NV− fluorescence.
(a) Experimental protocol. On a green laser sample scanning, we station the red beam at a fixed spot for a predefined, variable time, to finally image the area via a red beam scan. During the fixed-point illumination and scanning times the green beam is off. (b) NV ionization takes place via a two-step process in which the excess electron is ejected into the conduction band (CB) by the consecutive absorption of two photons of wavelength λ≤632 nm (steps 1 and 2). NV0 recharging takes place on absorption of an electron from the valence band (VB) following excitation with λ≤575 nm (steps 3 and 4). (c) The central figure displays the sample fluorescence as a function of the red illumination time tR for three different excitation powers before the readout scan. The top/down inserts correspond to fluorescence images obtained on scanning the red beam over an area xy on the focal plane around the fixed point. The time lapse tR before sample scanning is indicated in the lower right corner of each image. In all images, the green laser power is 750 μW; note that the red laser power is 500 μW during tR and 100 μW during the readout scanning, thus leading to different fluorescence intensities. Each image has 100 × 100 pixels and the integration time per point is 1 ms both throughout the scanned images and the fluorescence time traces in the central plot.

